This site contains affiliate links, view the disclosure for more information.
The modern-day updated, Google’s algorithm and ranking factors make use of subset of factors collectively termed: as Core Web Vitals to measure the speed, interactivity, and visual stability of your webpage. Previously, the Google’s algorithm and ranking factor of a webpage were mostly based on semantic search algorithms.
However, ever since Google has started prioritizing the UX (User Experience) to discern a webpage’s ranking, factors like the page load speed and mobile responsiveness, that directly relate with User Experience criteria, is what Google’s algorithm now utilizes as a guidance to discern a website’s quality signals.
Officially coming into effect as of May 2020 by Google, the Core Web Vitals basically serve Google’s way of scrutinizing your webpage’s overall UX.
Table of Contents
ToggleThe Three Core Web Vitals of Google
The three core web vitals of Google include the Largest Contentful Paint (LCP), Cumulative Layout Shift (CLS), and First Input Delay (FID). An advanced version of FID termed as Interaction to Next Paint (INP) is scheduled by Google to replace the former by March 2024.
Let’s understand what each of the metric term implies and how they affect your website’s SEO and (Search Engine Result Page) SERP rankings. Later in this post I’d be sharing how you can easily resolve most of the issues and have your Core Web Vitals metrics optimized for best site performance and excellent UX.
Largest Contentful Paint
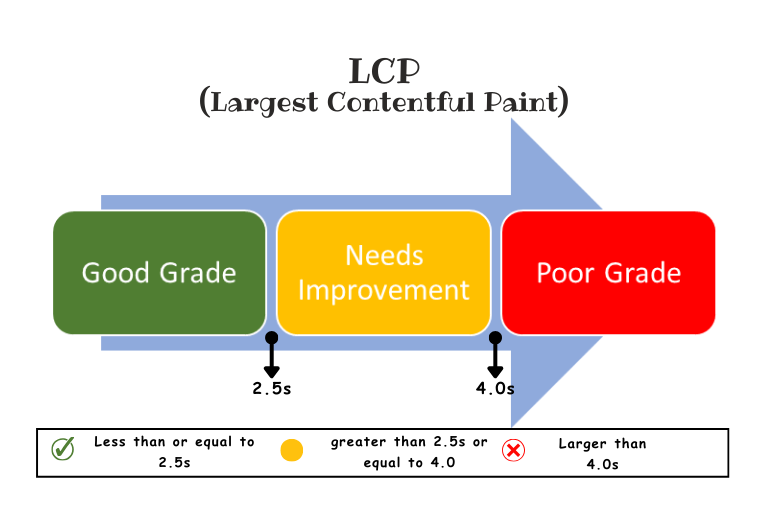
The time taken by ‘the largest element’ on your webpage to load is defined by the largest contentful paint, LSP. For your webpage to function optimally, this value is required to be less than 2.5 seconds. Exactly at 2.5seconds, it will do too, however, beyond that your core web vital assessment would either ‘require improvement’ (orange grade – LCP between 2.5 and 4.0seconds) or fail the assessment with a score above 4.0seconds (red grade)
You may ask: What does LCP has to do with SEO?
Other than helping you with delivering a better user experience, Google utilizes the LCS score factor in determining a ranking factor of websites and so it has a direct role to play in improving the SEO experience of webpages on your site. See that’s the whole point about why it matters!
And this is quite understandable because, think of it this way, staring at an almost blank page with the page’s biggest element not being loaded fast enough could make the visitors or users of your site feel annoyed enough to leave it for good. This counts because you know that in browsing, a matter of only a few seconds; brings about a significant change in visitors/users’ decisions!
In fact, the Largest Contentful Paint, which accounts for almost 25% of Google’s Page Speed Insights score metrics, is considered to be the most important of the three performance metrics.
Finding and measuring Your site’s LCP
While there are various ways and tools to finding and measuring your site’s LCP score metric, I find Google’s Page Speed Insights the easiest way of getting the score metric percentage alongside a detailed enlisting of areas that require improvement.
Now Page Speed Insights is a completely free tool with no limits, whatsoever, which means that regardless of having an ownership of a website, you can hop on and find a score metric of any webpage that you’d like to explore.
If a site you are analyzing has no active users, the data generated by Google’s Page Speed Insights is referred to as lab data. A performance data of site that is collected in a controlled environment is referred to as lab data wherein Page Insights simulates the performance of the site under observation with predefined device (the device you use for analyzing the site) and network settings (network connectivity speed that your device has, etc).
If the site under observation does have online real-time users, then the performance metric data that the PageSpeed Insights will generate will be a Real-Field data. A field data is a data derived from an aggregated data collected by Chrome’s CrUX (Chrome User Experience) report. All the data in the CrUX is highly valuable as it captures a real-time user experience data.
The reason behind the difference in the lab data and field data metric scores is simply the predefined conditions in lab data and real-time UX in the field data. As predefined conditions include dependability on factors like the internet connection, etc. it is rare that your lab data would reflect a 100% metric score and that’s an okay thing, above 90% is all good!
As for the field data, it is possible for sites (especially the new domains, and not the older ones) to have no real-time users at the time of analyzing. In that case, PageSpeed Insights won’t show you any field data and only lab data would be made available to you. That too would be okay because normally, the difference between field data and lab data is not significant.
Later in the post, I will cover that out of the three core web vitals metrics, lab data does not provides First Input Delay (FID) metric because it is a metric that requires real users interaction to be measured.
However, if you own a site, the Search Console can prove quite useful as it gives you a performance graph of all pages collectively, showing how many of them have a good score (green grade), how many need improvement (orange grade), and how many of them are offering poor UX (red grade).
Factors that affect your site’s LCP
Without getting into much details, let’s find out the main factors that affect a site’s LCP score:
Slow Server response Time
Whenever you lunch a query or search for a website in your browser, your browser sends a request to server for it to respond with the content requested. Sometimes the server is slow and your browser fails to receive the content requested by the server quicky enough to render a site on your screen This delay in load time affects the site’s LCP score.
Don’t worry about how to resolve this issue yet, I’ll provide you with an easy solution to this by the end of this post.
Render-blocking JavaScript and CSS
Immediately after your browser receives the requested content from a server, it does not render it on your screen instantly. Rather, rendering any content requires the browser to analyze or you can say parse and convert it to a readable HTML structure of the page. Only after this parsing is the content rendered and made fully available on your screen. During this parsing process, some scripts or stylesheets might try blocking the HTML parsing process, thereby delaying the parsing process. This delay plus the server response time delay discussed previously both affect the LCP performance metric of the webpage you are analyzing. Together they slow down the loading process. The scripts and stylesheets are what make up the render-blocking resources.
More on how to resolve these later in the post.
Slow Resource Load Time
Other resources on the webpage like the images, videos, and block-level elements like the HTML and CSS files that are rendered and loaded above the fold often take additional time to load (slow loading) which again affects your LCP score.
While keeping your file size of uploaded images, and videos low can help tackle this issue, however, as for the block-level elements like the HTML and CSS, installing and configuring the LiteSpeed Cache for WordPress plugin can work wonders.
Cumulative Layout Shift (CLS)
Coming onto the next metric, the Cumulative Layout Shift (CLS), do you happen to have any visible elements on your webpage that change their position or size that simultaneously affects the position or size of other content surrounding it?
Say, for example, an ad loads above the fold and pushes some of the content on the page further down. Or maybe you tried to click on a link or a button but ended up clicking on a wrong link or button because a new bigger image causes the existing content on the page to move down.
If you’ve had experienced this, you know how annoying it gets!
And since Google’s Core Web Vials are there to monitor the UX that your webpage serves your users with, Cumulative Layout Shift (CLS) is the second important part of it. You can say that the CLS metric actually looks for the visual stability of your webpage.
The number of unexpected layouts shifts that happen on a webpage affects its CLS score metric. The term unexpected here refers to the layout shifting happening without you clicking or interacting with the page.
Since Cumulative Layout Shift (CLS) is a highly relevant metric for UX, it accounts for 25% of the PageSpeed score and is therefore an important factor to consider for your webpages’ SEO performance.
Finding and measuring Your site’s CLS
Again, for finding and measuring the CLS score metric for your website, I personally use and recommend PageSpeed Insights, although other tools are available.
Other tools either require you to sign up to get score metric results, or they’d stick to providing you with one type of data which could be lab data, field data, or CrUX (Chrome User Experience) Report. PageSpeed Insights is free, and it provides you with both field data and lab data along with the pin pointing of elements that cause layout shift in the diagnostics report. For instance, consider the field data of a reference website (Image Source: Google)
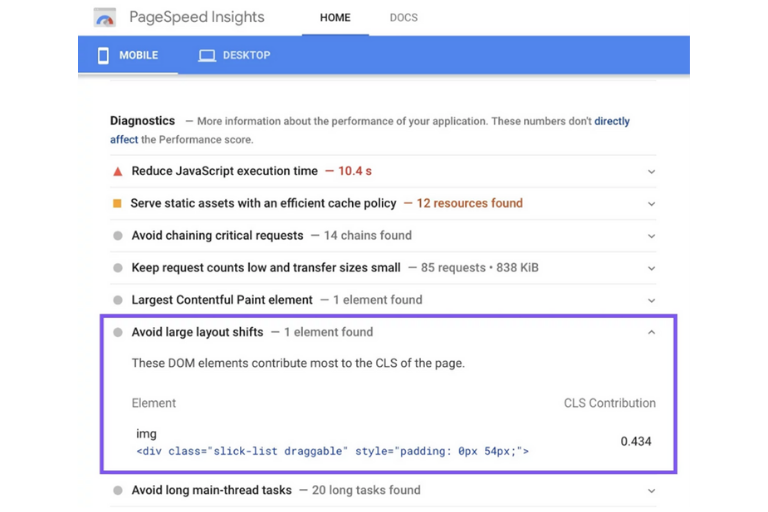
In the reference image above, you can clearly see how PageSpeed Insights enlists all the elements, each with its CLS contribution score, that cause layout shifts. This makes it easier for you to understand how each of the element contribute to the overall calculated CLS score.
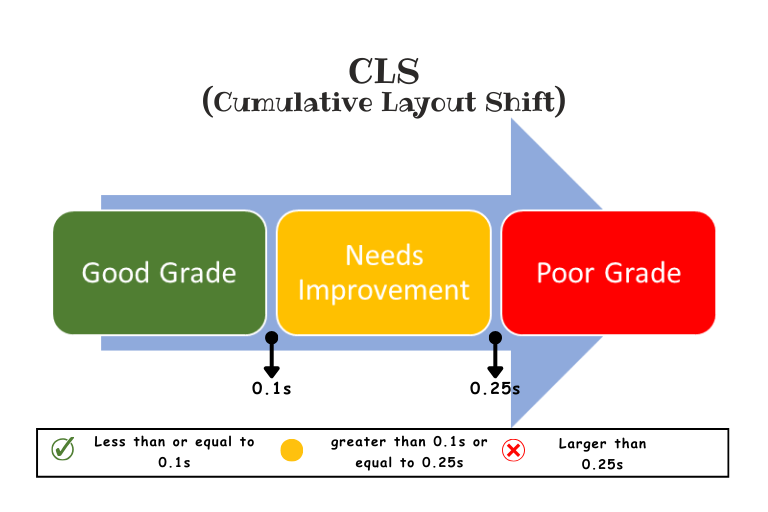
A good CLS score range is either equal to or less than 0.1 (Green Grade)
For a range between 0.1 to 0.25, the CLS score metric would bear a “needs improvement” status (orange grade) and of course for grades even higher than 0.25, CLS would be marked as “poor” (red grade) by PageSpeed Insights.
Just like LCP, CLS can also be found for all pages on the site using Google’s Search Console. This makes it quite easier for you to analyze the site wide performance of the Core Web Vitals for the domain/website that you own.
What makes Search Console the best and easiest way to analyze the core web vitals is that it allows you to view a complete list of your site’s URLs that are affected by the same issue. That way you do not get to input and analyze individually the URL of each page on PageSpeed Insights.
For example, under the core web vitals tab in the Search Console, you can explore a detailed report of your site’s performance on both Mobile and Desktop. Say, for example, in the Mobile report of your core web vitals, you may find a detected CLS issue that reads: “CLS issue: more than 0.1 (mobile)”. Refer to the image below: (Image Source: Google)
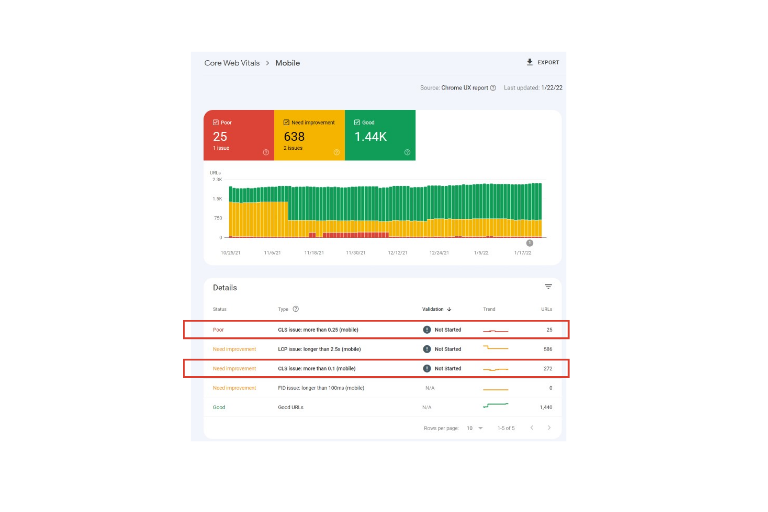
See the how search console enlists URLs facing the same issue under one type. The above figure shows two CLS issues, both encountered on mobile device: one with CLS score more than 0.1 which is an orange grade, stating “Needs Improvement” and the other one with 0.25 s which is marked as a poor grade.
Having understood the method of measuring and finding CLS, let’s move onto the factors that affect the CLS score.
Factors that affect your site’s CLS
Added animations (Content that gets injected dynamically)
Now this does not imply not to use animations at all on your webpage!
Not all added animations contribute to your CLS score, that’s because Google ignores the CSS transform property. This means that by using a CSS transform property for your animations, you can have a control over your CLS score.
But, I understand that just like me, most people do not want to get into these ‘code transformation’ things, and so later in the post, I’ll share with you an even easier solution to overcome issues related to CLS score adjustments.
Images and Videos Used without specifying dimensions
These make for the most common reasons for Layout Shifts.
When you do not specify specifically the dimension size of images and videos for Mobile View, browsers normally self-assign and reserve a space for these media files. Once the media file gets loaded, the reserved space might be more than required and as a result, the content which was loaded and displayed earlier than the media file, shifts.
It’s therefore a good practice when optimizing your website for mobile Responsiveness to specify the dimensions of the media file to be displayed on the webpage.
Actions that require waiting for a server response before DOM gets updated
This especially happens in the case of advertisements placed on websites. The reason again here is the “not specified” dimensions for the proper deploying of such content on your webpage.
This makes it evident the essentiality of allocating a space with proper dimensions to elements that are intended to engage users. If not done properly, they ruin your site’s overall User Experience (UX). Ads, embeds, and iframes appearing on webpages without proper dimensions specified all contribute to layout shifts, making search engines aware of the bad UX performance available on certain site.
Use of Fonts that cause Flash Of Unstyled Text (FOUT) or Flash of Invisible Text (FOIT)
Usually during webpage rendering, the custom font style you used in designing your page takes some time to load.
In the meantime, fallback font is used by the browser to display your content to users. Once the custom font gets loaded, it replaces the fallback font and the content appears exactly with a font you designed your webpage with. This phase of your custom font getting loaded and the fallback font appearing on your webpage is referred to as FOUT.
Now the amount of space taken up by fallback font would most probably vary compared to the space taken up by your custom font when loaded. Inevitably this causes layout shift.
There is another term related to webpage fonts: the FOIT. Flash Of Invisible Text occurs when during page rendering, no text appears on your screen, again due to the custom font being in the rendering phase.
Even though CLS metric score is calculated for both Mobile and Desktop, however, the most common impact of CLS occurs on mobile devices because mobile devices have several challenges like smaller viewport, sometimes an arduous network connectivity, and a weaker Central Processing Unit compared to Desktops.
To fix issues related to font rendering, it is recommended that you pre-load the fonts and optimize them. What this means is that you tell the browser (through certain code or setting of a plugin) to load the fonts as one of the top priority resources. That way, the browser will load the fonts prior to when the first meaningful paint gets painted.
The first meaningful paint happens when a webpages’ primary content is fully rendered, loaded and displayed successfully on your screen. If the fonts have been loaded already prior to this, your page gets loaded with the custom-styled font with the settings saved at the back end, and so no layout shift occurs.
First Input Delay (FID)
Did you ever experience a delay in the response time of a browser when you land on a webpage and click on a certain link?
While you expect the browser to respond back and entertain your request almost instantly, you often come cross a situation where nothing happens, and yet the browser seems to be a bit busy processing somethings in the background (‘somethings’ basically are JavaScript Executions carried out by the browsers in the background to fully render the webpage).
First Input Delay is the delay caused by browser in processing a user’s first input. This delay is usually caused due to the browsers’ memory being utilized in processing other requests related to page rendering i.e. page loading.
You know how annoying it gets when you click on a link, waiting for something to happen on a page, but the browser stands there idle!
As its name implies, FID requires a user interaction on a webpage to be measured by core web vital monitoring algorithms. That is why, only when the field data is available, FID would be available.
You might have seen in the core web vitals report generate by some tools a metric known as the Total Blocking Time (TBT). Well, it is a lab metric, a proxy used to measure interactivity and responsiveness without having anything to do with a user interaction.
Tools like the Lighthouse which can’t measure First Input Delay, make use of the TBT lab metric. In such cases, a good TBT value accounts for an acceptable FID grade.
In order to make better your FID score, one of the options is to improve your TBT score as it accounts for almost 30% of the overall performance score generated by PageSpeed Insight which is more than both LCP and CLS. You can refer to the scoring calculator here.
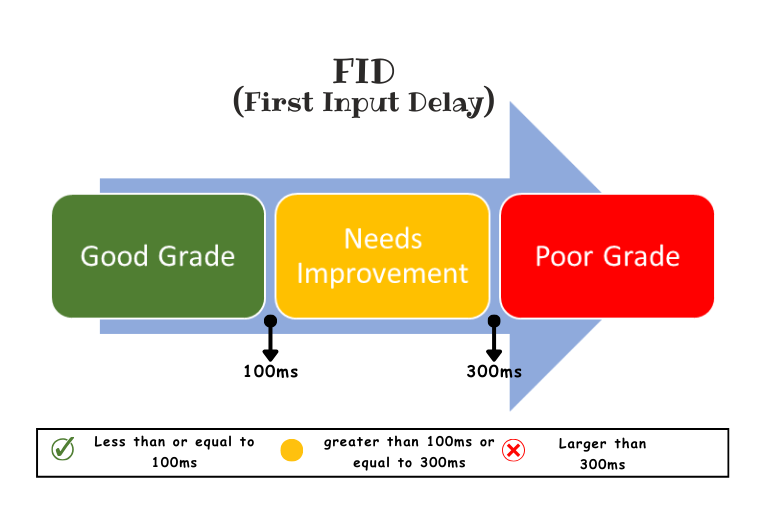
FID score is said to be in good grade when it is equal to or less than 0.1s = 100ms
For FID scores greater than 0.3s = 300milliseconds, your page speed would be marked as poor by core web vitals monitoring tools.
One question that often pops up in our minds is that how TBT is used by tools to measure the field data and that if it has the same score window as that of FID mentioned above. Let’s first get this straight for you!
Understanding a good TBT score
As mentioned previously, TBT is not dependent on user input. FID, however, as its name suggests is dependent on user’s first input.
What this implies is that TBT is the window frame in which user interaction on page is ‘blocked’, therefore, not allowing users to interact with the page even when the tap, click, press keyboard buttons, etc. As soon as this time frame window, which is basically a TBT, is passed, user interaction gets enabled on the page. Summing up the total ‘blocked times’ for user interaction helps determine TBT score.
In technical terms, you could say that the sum of all the timestamps in between the FCP (when you get to interact with the first content on the page) and Time to Interactive (the time taken by the entire page to become fully interactive) determines a score value of TBT.
TBT also has a three-grade score value in which case it would bear a good score for a timeframe value of less than or equal to 0.3seconds(300ms). For a range between 0.3s(300ms) to 0.6s(600ms) TBT score would require an improvement. Above 600ms, it would be marked as a poor grade TBT score.
To sum up, you can say that both FID and TBT consider page responsiveness and interactivity with FID actually taking into account the user interaction and TBT considering user input. Therefore, both metrics though, appear to be identical, but are technically different.
Measuring the First Input delay FID
Since FID is a field metric that requires user interactions to be measured, tools like Lighthouse, Chrome DevTools, and WebPageTest, etc that can’t measure field data can not help you in determining your webpage’s FID score. These tools as well as the Google’s PageSpeed Insights, however, can measure TBT, the proxy metric.
Few tools like the field data of PageSpeed Insights, Search Console, and Chrome User Experience (CrUX) report can help in measuring FID.
PageSpeed Insights is the easiest and free method to measure your FID, so long as your site has active users at the time of scan, because only then will the tool measure field data.
The TBT score of your page comes under the Lab Data report of PageSpeed Insights, for it being a proxy metric.
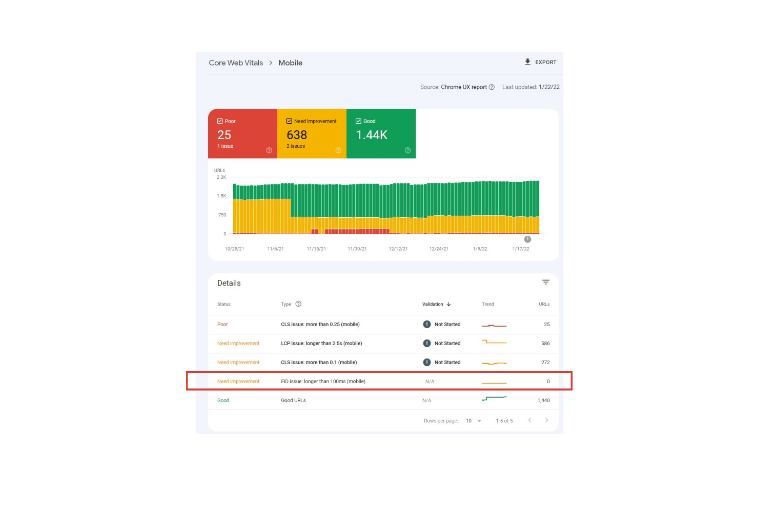
Search Console can prove useful in determining the site wide FID score and its performance. Similarly, as was discussed previously in the measuring of CLS using Search Console, you could encounter a similar error message for your site URLs in the case of FID measurement. Refer to the image below:
By clicking on the error message highlighted above, Search Console will enlist all your site URLs that are affected by the same issue. For instance, take a look at the following image(Source: Google Images)
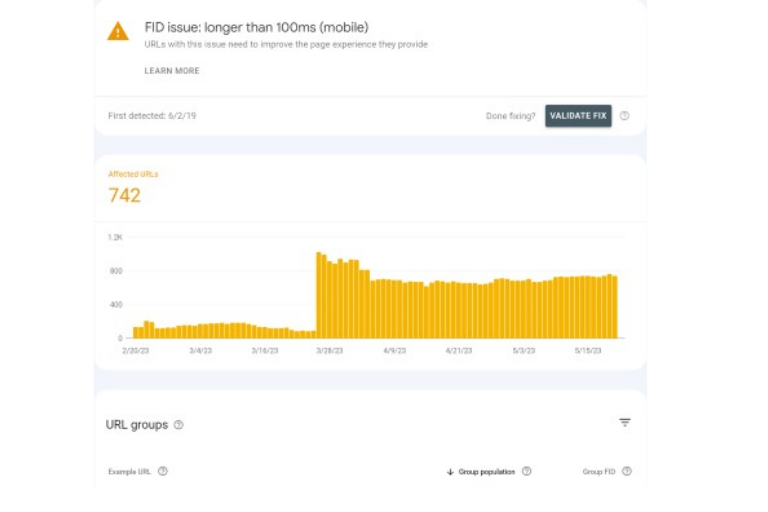
The above image shows that a particular website has a total of 742 URLs affected by the same issue and that is FID issue: longer than 100ms.
What’s more to it is that, down the ‘Example URL’ column, Search Console even enlists the exact URLs facing the issue which makes it pretty easier for users to get the score metric improved as needed.
Factors that affect First Input Delay
As is understood so far that FID is the delay that occurs entirely due to the browser being busy with entertaining page rendering and loading requests in which browsers get to deal with the processing of heavy JavaScript files.
Now these JavaScript files are heavy enough to flood the memory cache of browsers so much so forth that there does not remain any room for entertaining any additional requests. As a result, interactivity on the page is poor, main thread is busy processing JavaScript files and the page is blocked.
This makes one thing straightforwardly easy to understand: reducing time of JavaScript files execution can help with improving the FID score metric.
So, you might wonder: where do these JavaScript files come from and why do they take so long to execute?
Here’s the thing, all the web page content on the world wide web is basically created using a scripting language called JavaScript. So, whenever you type certain URL in your browser, your browser first looks up the IP address for that specific domain you entered as part of the URL.
After finding the IP address for the domain, your browser than initiates a Transmission Control Protocol (TCP) with a server after which it sends the HTTP request to the server. The server than processes the request and sends back a response to the browser.
Once your browser receives a response from the server in the form of HTML which is a structure of the page. Your browser than starts parsing and rendering the received HTML. To load the requested webpage as it was designed by the developer, during parsing and rendering process, your browser references other JavaScript, CSS, image resources and additional requests. That’s how complex JavaScript files execution flood your browsers cache memory.
For an even detailed understanding on how your browser returns your requested URL refer to this post.
Back to the matter of FID score metric, if you have had experience building a website using WordPress, or similar software, you know that plugins are there to make your life even easier with website development. But what you might not know is that most plugins, especially the ones that are JavaScript based, add an additional burden to initially rendered JavaScript files. The result is an even prolonged JavaScript file execution time or in simple terms an increased FID score metric.
Did you ever read in forums people asking questions about getting somethings resolved on their website without installing any additional plugins?
Not wanting to increase a burden on JavaScript files is one of the probable reasons behind it! And that’s logical too, you should prefer getting things done without plugins where you have the counterpart course of action to it and use plugins only when it becomes necessary to use one.
Then there are theme files which too can affect your site’s FID score. That’s because heavy themes again have larger JavaScript files. Additionally, some themes are designed in a way that aren’t efficient enough in terms of design which affects the main thread – again affecting your site’s FID score.
Reducing FID and improving the score metric requires that you work on improving how browsers deal with JavaScript files. If the execution period of JavaScript files unfolds smoothly and faster, the browser can actually allow interactivity and page responsiveness at its earliest. e
Improving the First Input Delay Score metric for your site
In order to improve the FID, you can take the following actions:
- Deferring JavaScript – this makes the browser load the render-blocking resources after the most relevant content on page has been rendered and the user interactions are unblocked on the page.
- Removing Unused JavaScript – this allows restoring page rendering and downloading time by avoiding browsers a burden of processing unused JS files.
- Delaying JavaScript Execution Time Until User Interaction – Ever see a webpage load when you scroll? That is basically a good example of delayed JS file execution in page rendering. This delay is added to the JS files that affect loading and execution time for no reason. Consequently, unless a user interacts with the page (scrolling for example) only then will the remaining JS files get executed.
- Minify JS – This simply involves reducing JS script coding lines by eradicating line breaks, white spaces, or any comments. The process simply allows making file size smaller and much more efficient.
- Removing or reducing unused CSS – Helps in improving loading time which improves FID score metric and user interactivity on page when it gets loaded.
- Asynching or Deferring CSS – Provides the same function of render-resource blocking as in the case of ‘Deferring JavaScript’ but for CSS files.
- Compressing text files – Compressing files makes them smaller and easier to be transmitted thereby, allowing for faster loading time
- Breaking up Long Tasks – In order to save the main thread form getting blocked due to heavy long tasks and consequently block user interaction on page, splitting longer chunks of data into smaller, more efficiently execution able small tasks.
Improving your site’s overall Core Web Vitals with LiteSpeed Cache

When SEO is in question, you can’t take errors for granted because if it weren’t for the role of core web vitals in SEO, improving your site’s overall speed metric would not have been this common of an issue faced by website owners.
With plenty of tools and plugins out there that can help you improve your Core Web Vitals, I prefer using LiteSpeed Cache Plugin.
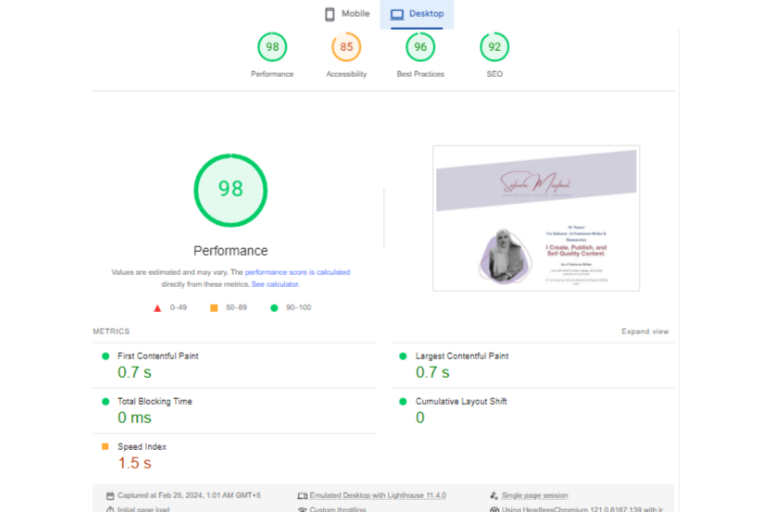
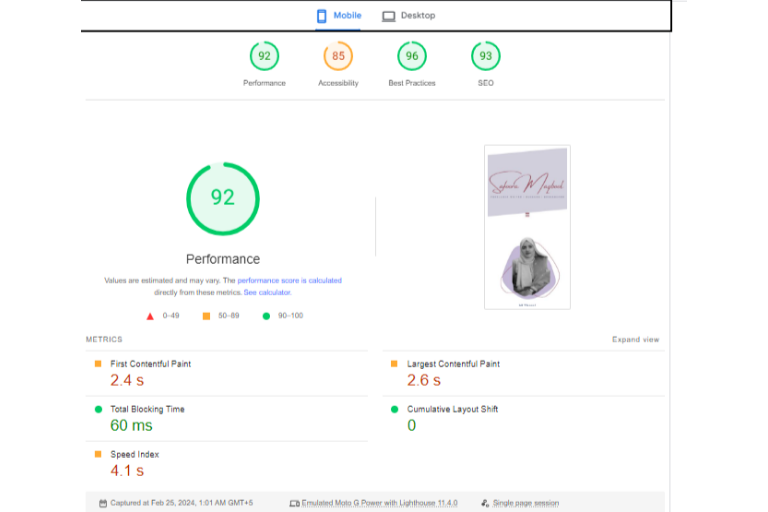
That’s simply because installing and configuring this lightweight plugin helped me improve my site’s core web vitals report from 86% all the way up to 99% for Desktop, and 75 to 96% for Mobile device.
Here’s the screen shot of my site’s Core Web Vitals report after installing the LiteSpeed Cache Plugin. (I used PageSpeed Insights + note that lab data was not available as my website is brand new)
For Desktop:
For Mobile Device:
Here’s how you can download, install, and configure the Litespeed Cache plugin on your WordPress site.
Downloading, Installing and Configuring the LiteSpeed Cache Plugin
Download/Get the plugin from the company’s official website here. If you have a single domain, small, portfolio or blogging website like mine, you can start with a free starter pack for now.
Or if you own multiple domains and want to get the plugin for all of them, you can choose the Site Owner Pack.
Once you have downloaded the plugin zip file. Go to your WordPress Dashboard, hover over Plugins and select Add New Plugin from the pop-up cascading menu.
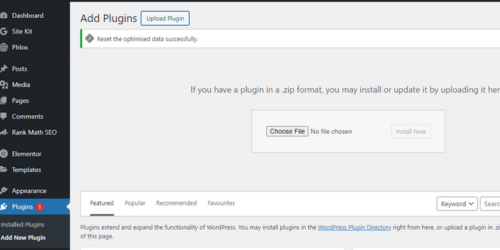
Click on Upload Plugin and give path to the downloaded file for it to upload on your WordPress.
Install the plugin and activate it.
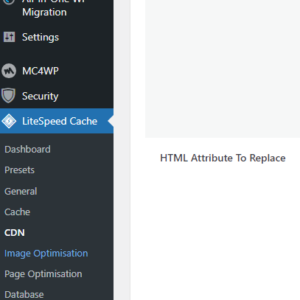
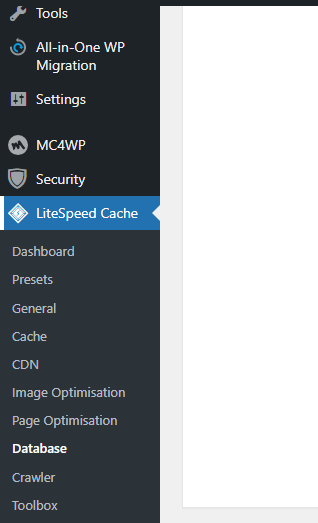
After activation you will see the “LiteSpeed Cache” option in the left menu of your wp-admin. Click on it and you’ll be taken to the dashboard of the plugin.
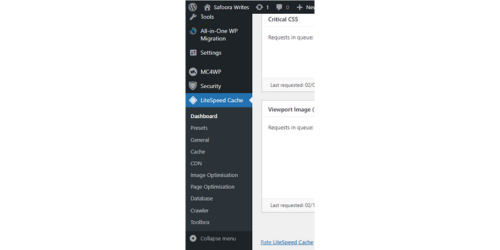
Now to configure your LiteSpeed Cache plugin, let’s go through each of the steps in the left menu one by one.
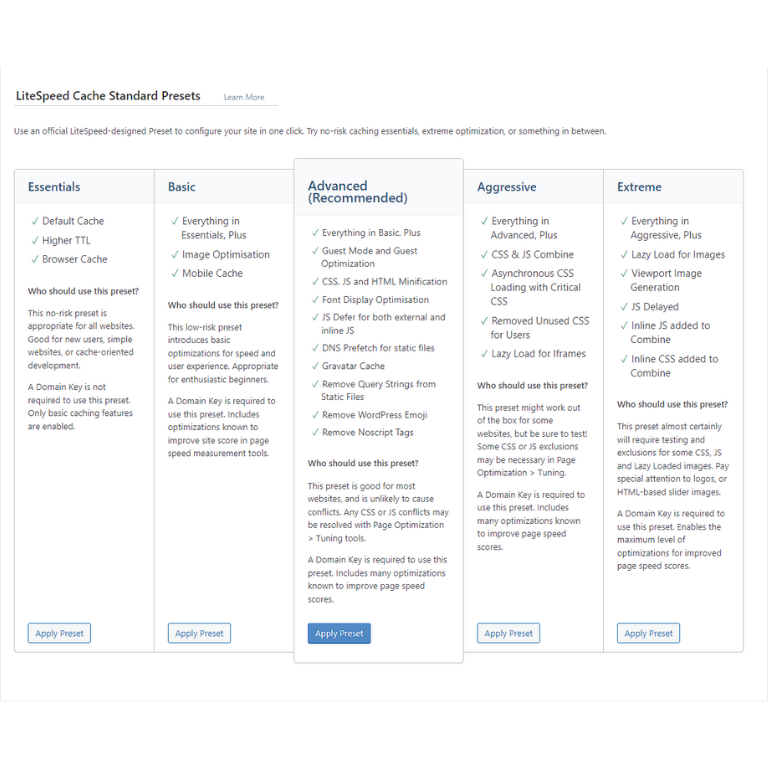
First off, the plugin also provides you with a ‘preset’ option. This is good if you really do not want to bother looking into how the plugin optimizes your page speed score, you can just select one of the preset and get it going with few clicks.
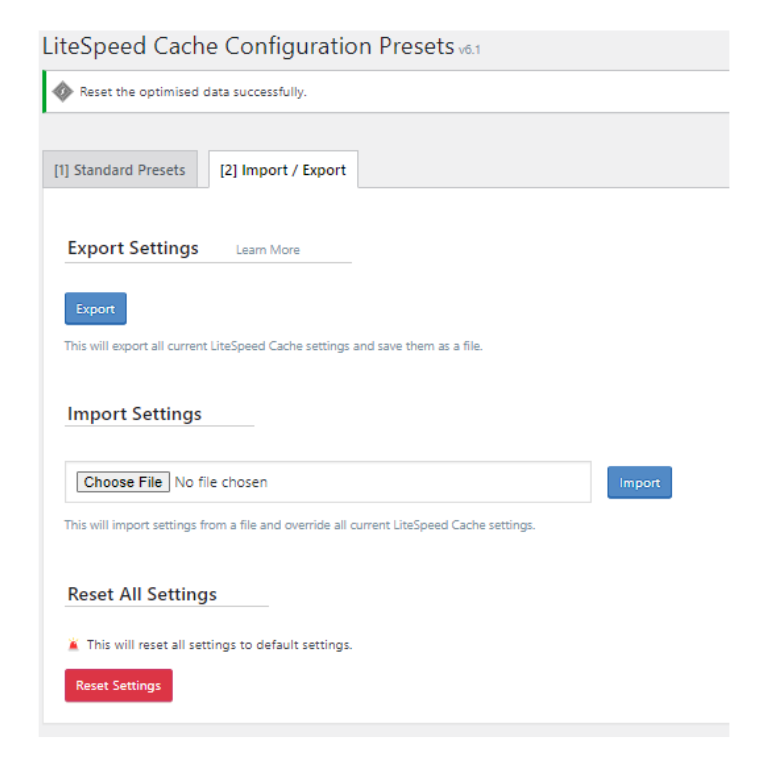
The next tab in the preset option ‘Import/Export’ is useful when you are deploying a lot of websites and all are built using the same theme. This feature helps you configure you LiteSpeed Cache only once and export all the settings applied in a file and then install/import that file with all the configuration in every other website you want the LiteSpeed Cache plugin configured. Simple as that!
But, if you do bother about how the plugin functions exactly and how it affects the content displayed on your website, it is better (and recommended) to go over the steps one by one so that if there’d be something mishappening on your website you’d know what option to toggle on/off for the site to run smoothly.
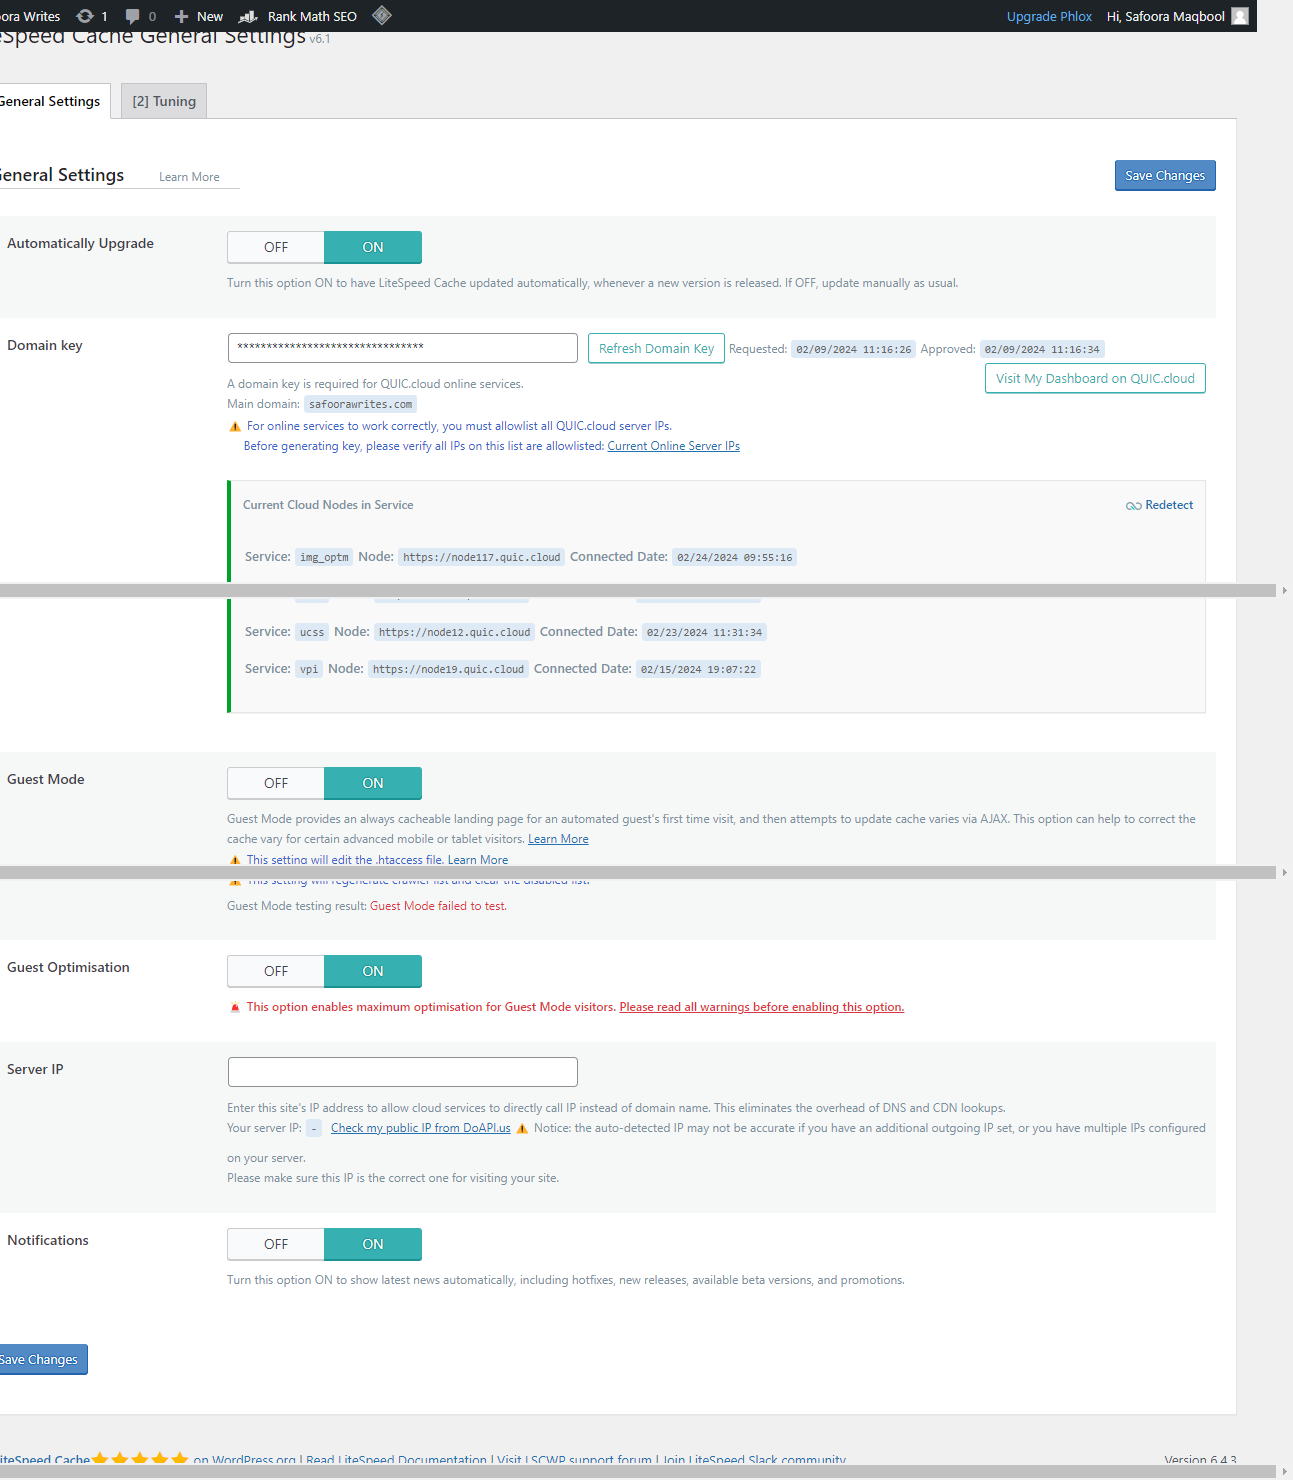
Moving onto the ‘General’ settings, here you’ll first need to enable the automatic updates for the plugin. (If you think you log in quite often and can update the plugin manually, you can skip this)
Next, we will be using the CDN of QUIC.cloud and for that you’ll need the domain key. QUIC.cloud allows caching dynamic WordPress pages. To get the domain key, press the ‘Request Domain Key’ button and wait for few seconds before you refresh the page.
Once you refresh the page after waiting for some seconds, domain key will be automatically added and the button ‘Link to QUIC.cloud’ would be enabled. Pressing on the button you’ll be redirected to the QUIC.cloud website and there you’ll create an account by signing up (completely free). If you already have an account with QUIC.cloud, signing in is what you’d be doing.
After signing up, you’ll receive an email for account confirmation. Confirm and sign in to your QUIC.cloud dashboard. After login your QUIC.cloud would be successfully linked with your website. Great! Now let’s move on to other setting in the General Tab.
Toggle On the following: Guest Mode(benefits people who visit your website for the first time), Guest Optimization, Notification.
Here’s a screen shot of how the general settings tab looks after configuration.
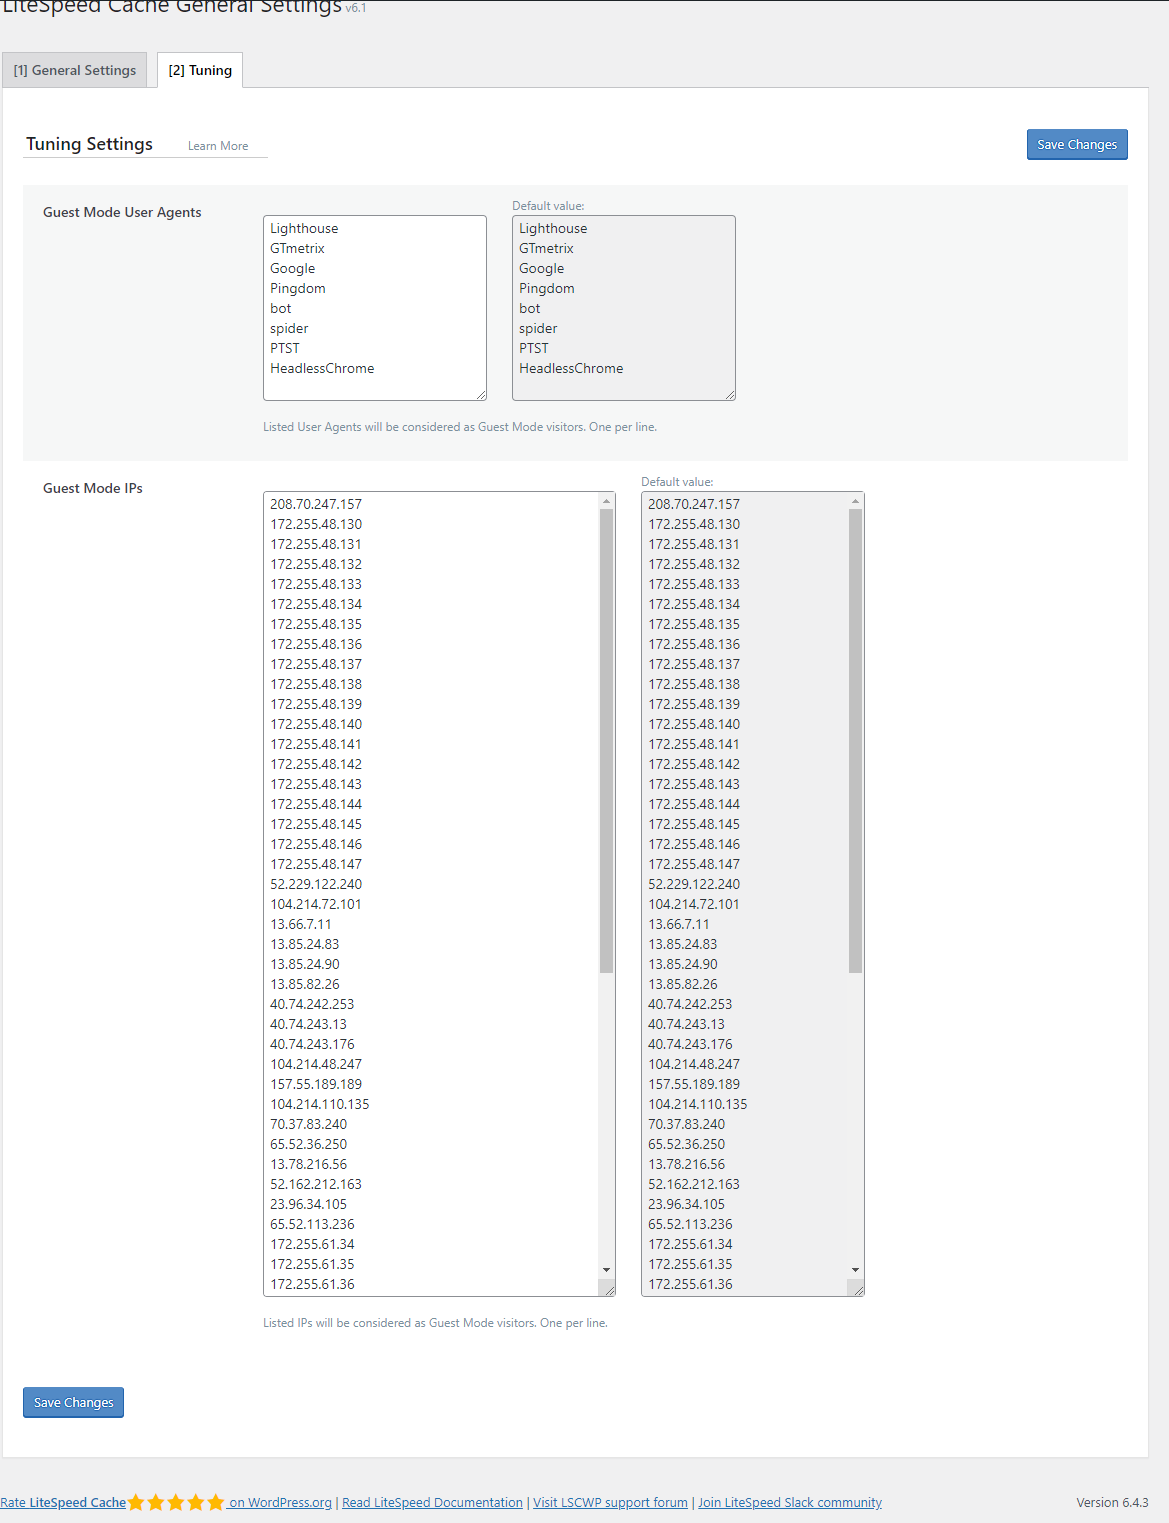
Next, we head onto the ‘Tuning Setting’ tab in General Setting. In the tuning tab, the first option you get is ‘Guest Mode User Agents’. This allows you to remove some of the tools from the Guest Mode. For example, if you want to disable the GTMetrics tool in the Guest Mode, you can simply remove it from the list and press save changes. This setting is entirely up to you to configure.
After the General settings of LSCache have been configured, we move onto the ‘Cache’ setting from the left WordPress menu for LiteSpeed Cache Plugin.
The first thing you’ll see here, if you are following this tutorial step by step from the beginning, would be a warning: LSCache Caching functions on this page are currently unavailable.
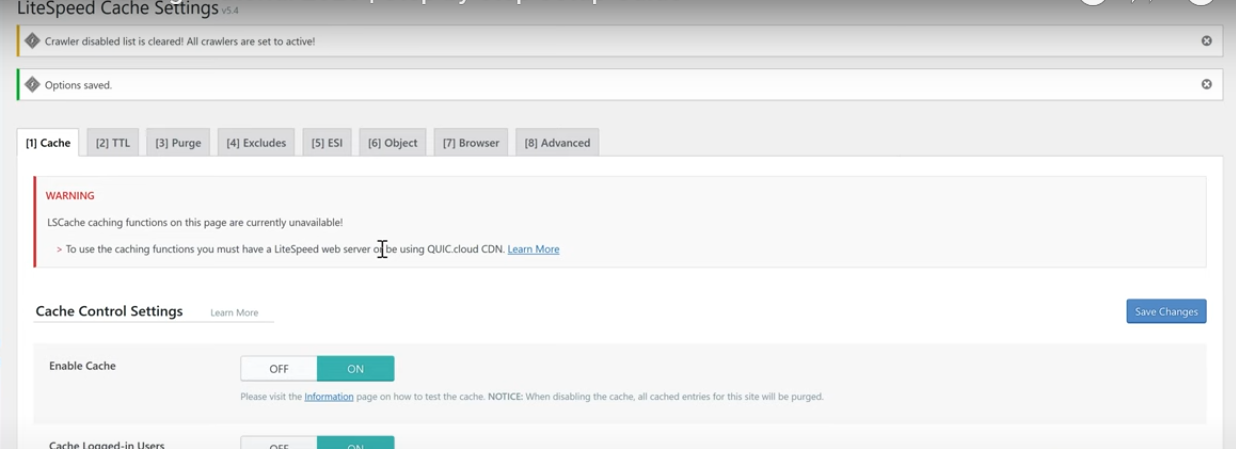
This warning happens because your site is most probably using the Google Cloud for caching and not the LiteSpeed web server. To get over with this warning, go to the CDN settings from the left sub-menu of LiteSpeed cache plugin in WordPress and simply Toggle On the QUIC.coud CDN. Save the changes made and head back to Cache setting.
Now the warning message must be gone. In the cache setting, all button settings would be by default Toggled ON. However, ‘Cache Mobile’ setting by default is turned OFF. If you are using Guest Mode, you should put your Cache mobile setting to ‘ON’. But if you are using a responsive theme like Divi, or Elementor, or Astra, you can keep this option OFF. For now, we are using the Guest Mode so I’ll toggle this to ON.
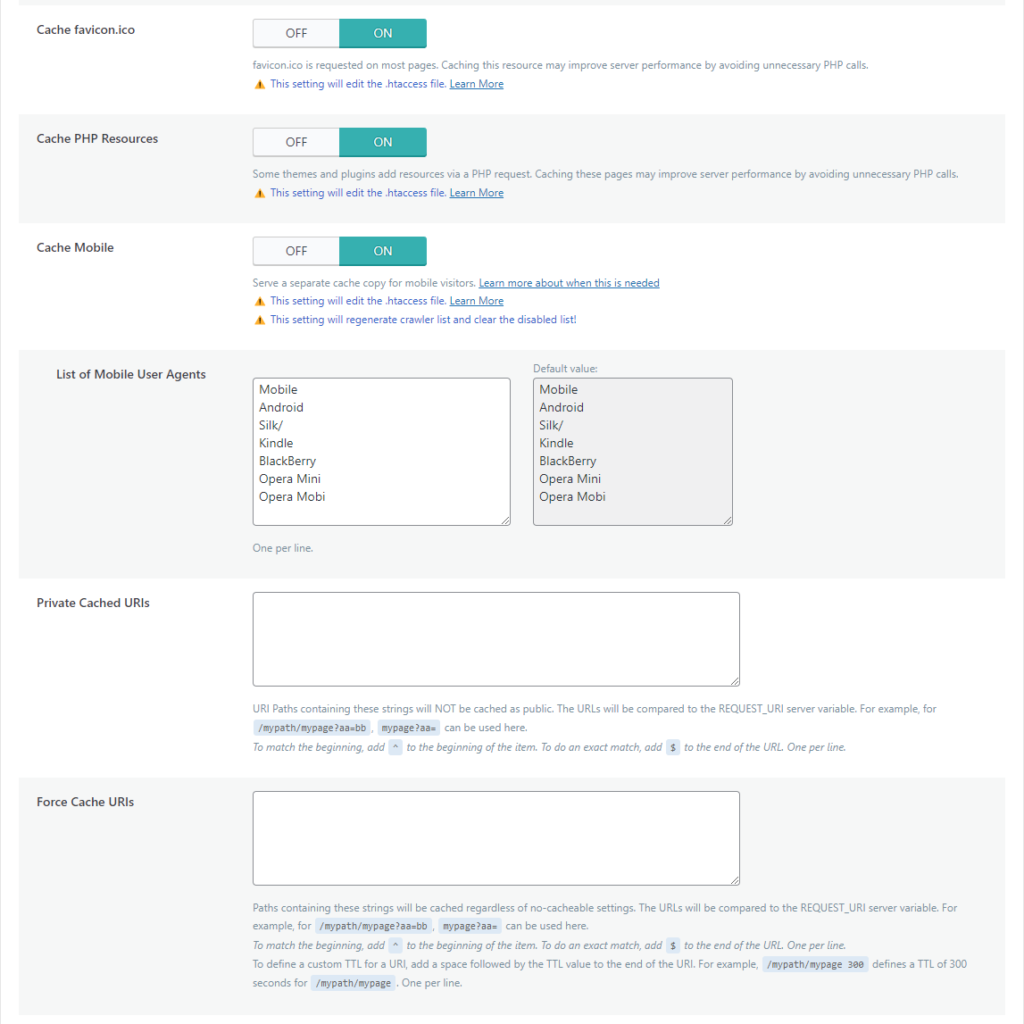
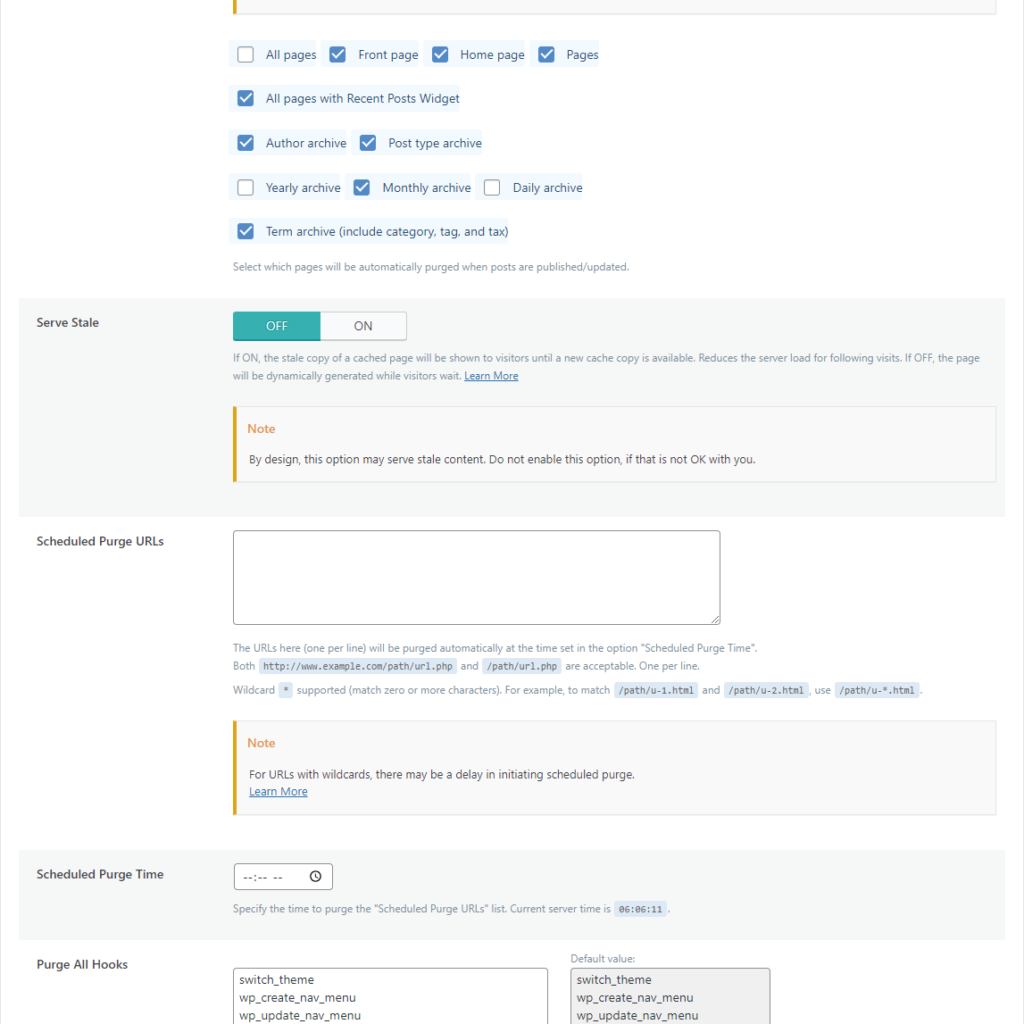
Save the changes made and move onto the next tab “TTL” tab in Cache settings which is basically a Time To Live. In the TTL setting, ‘Default Public Cache TTL’ is by default set to a value ‘604800’ seconds = 1 week.
What this means is that when a visitor visits your site, the files downloaded will be cached for a maximum of 1 week. So, if the visitor returns to your site within the 1-week time frame, the browser will not have to reload the files and therefore, page loading will be fast. However, after 1 week time period, the cached files would be purged and upon re-visiting the site files would have to re-load from scratch. You can increase or decrease the timings of retaining and purging the cache as your site might require. The rest of the TTL settings are good and no changes are required for them so, we move onto the next tab ‘Purge’ settings.
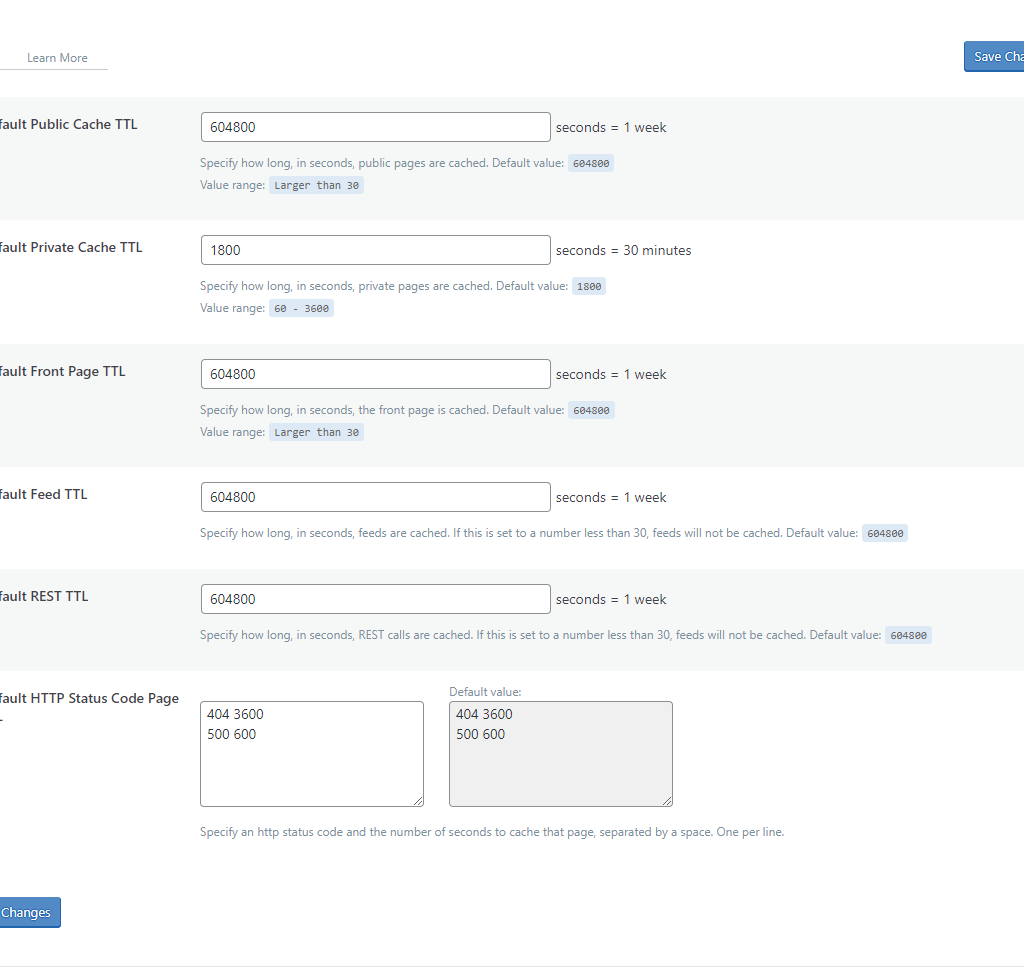
In the ‘Purge’ setting, first off you’ll need the ‘Purge All on Upgrade’ button toggled ON. This is important because when you update your theme or some plugin, you’d definitely need the entire cache cleaned. This is an important feature that any caching plugin should always have.
Sometimes it so happens that web developers find the need to purge certain URLs on a scheduled basis. LiteSpeed Cache can help in such scenarios. All you got to do is get to the TTL setting tab under the Cache settings, and there you’ll find a ‘Scheduled Purge URLs’. Add in the URL manually then in the ‘Scheduled Purge Time’ setting, set the time at which you want the URL to be purged from cache. In a general setting, we leave it as is as we do not want any of the specific URLs purged from cache.
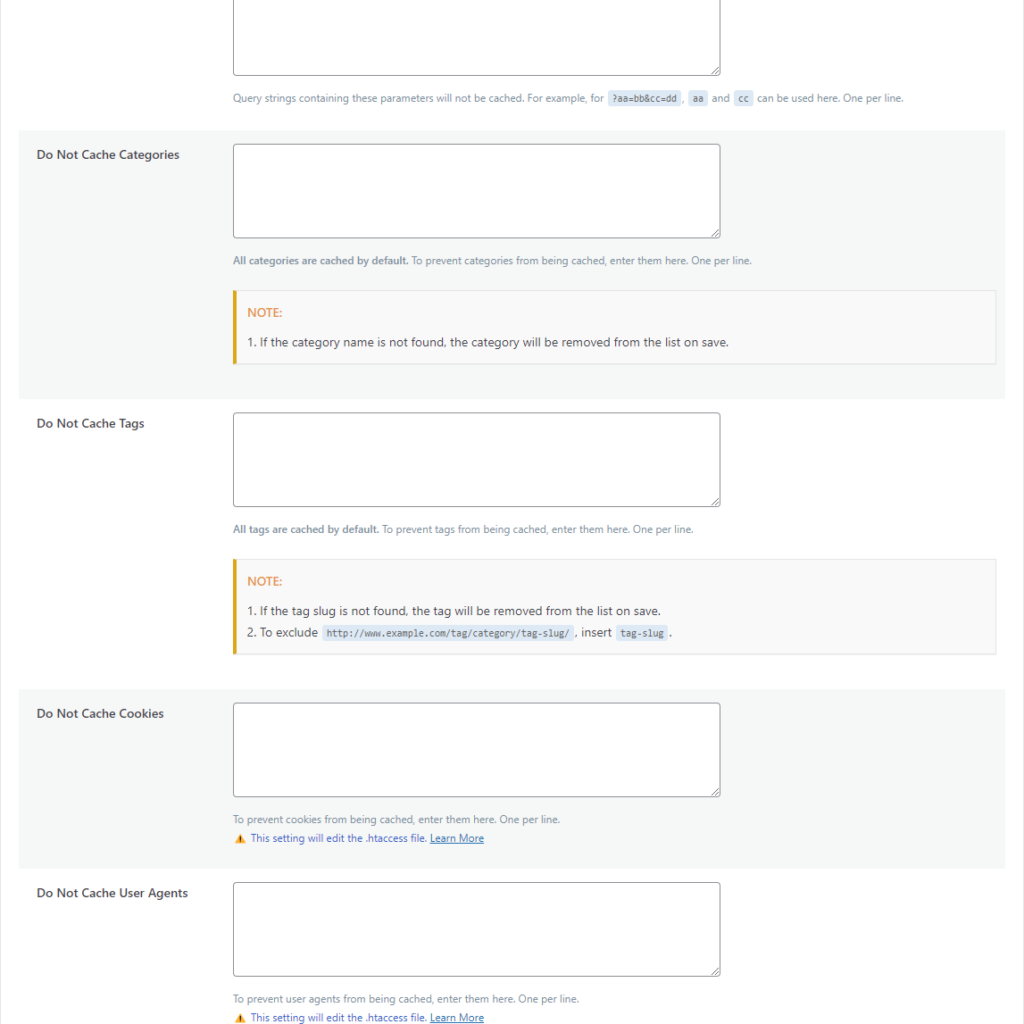
The rest of the settings don’t require any changes, so, save the changes, and move onto the next tab ‘Excludes’. The initial settings would remain as is/no settings required but towards the end of the page scrolling you’ll come across a ‘Do Not Cache Roles’.
Now when you are working a lot on your website changing pages, adding new things, or simply when you are an administrator, you want no caching involved in your website. That’s because caching usually delays image loads, etc. and as a result if you design a page, it might not appear to you the way you designed it (due to delayed image loads, etc.). In such a case, you might think there is some issue with your website whereas, in actual case there is no issue, just caching plugin doing its thing in the background.
So, the last option in the ‘Excludes’ tab is to select the ‘Administrator’ role only under ‘Do not Cache Roles’. That way administrators won’t experience any caching on the website when they are run-testing it. Save the changes applied and then move onto the next tab settings ‘ESI’.
The ESI (Edge Slide Includes) settings come in quite handy when you have a website where lots of people log in like authors, writers, or contributors, etc. and the site constantly keeps getting updated. Then you’ll need Enable ESI Toggles ON. But, since my site is personal and small, I skip the ESI settings and move onto the ‘Object’ tab settings.
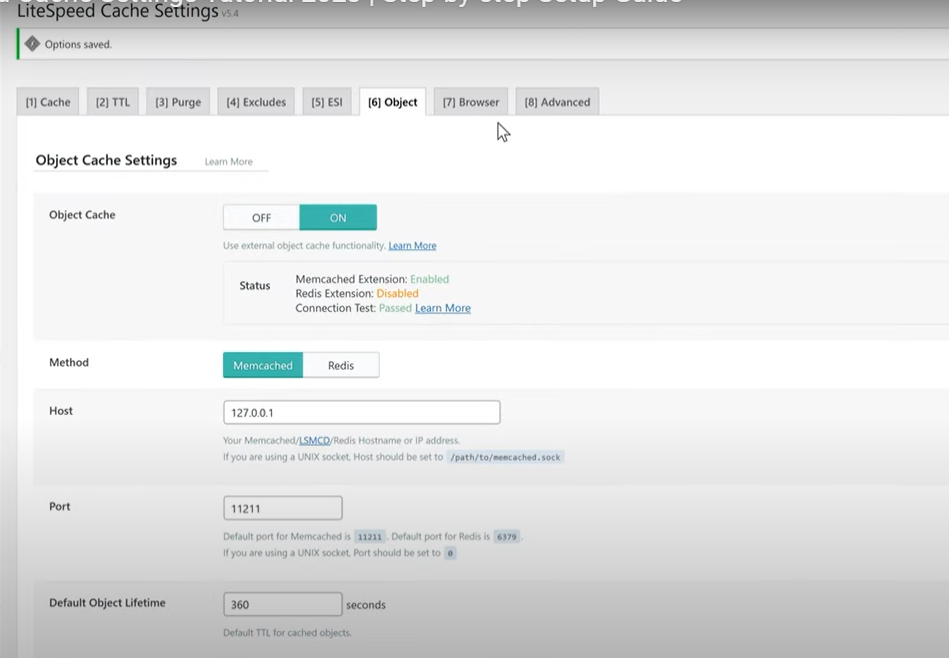
In the Object tab settings, I toggled ON the Object Cache feature which is a powerful feature to speed up your website. Next, to connect your WordPress to the Memcached server options within your hosting, in the Method setting select “Memcached”, add host value: 127.0.0.1, Port: 11211 and save changes. You’ll see the status of connection Test that appears below the ‘Object Cache’ option change to “Passed”.
Sometimes, rather than Memcached your hosting provider might allow Redis only. In this case the Status of Object Cache will show Memcached Extensions: Disabled, and Redis Extension: Enabled. In such a case you’ll have to connect Redis server with your WordPress.
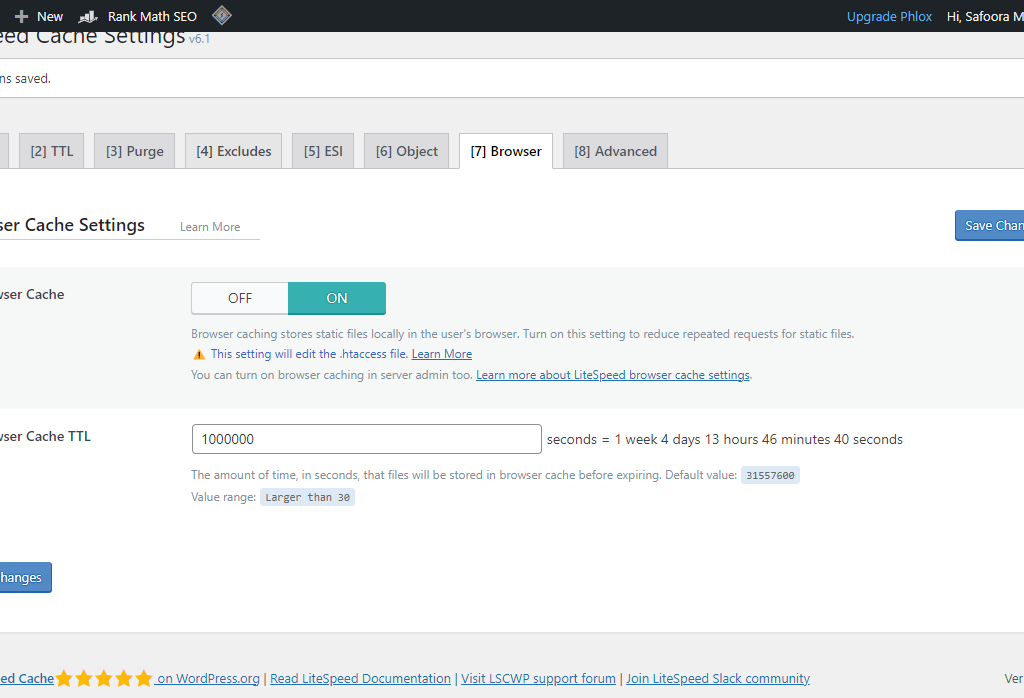
Next onto the Browser Tab settings. Toggle ON the Browser Cache button, and change the Browser Cache TTL value to 1000000 seconds = 1 week 4 days 13 hours 46 minutes 40 seconds. Save changes and move onto the Advanced tab settings.
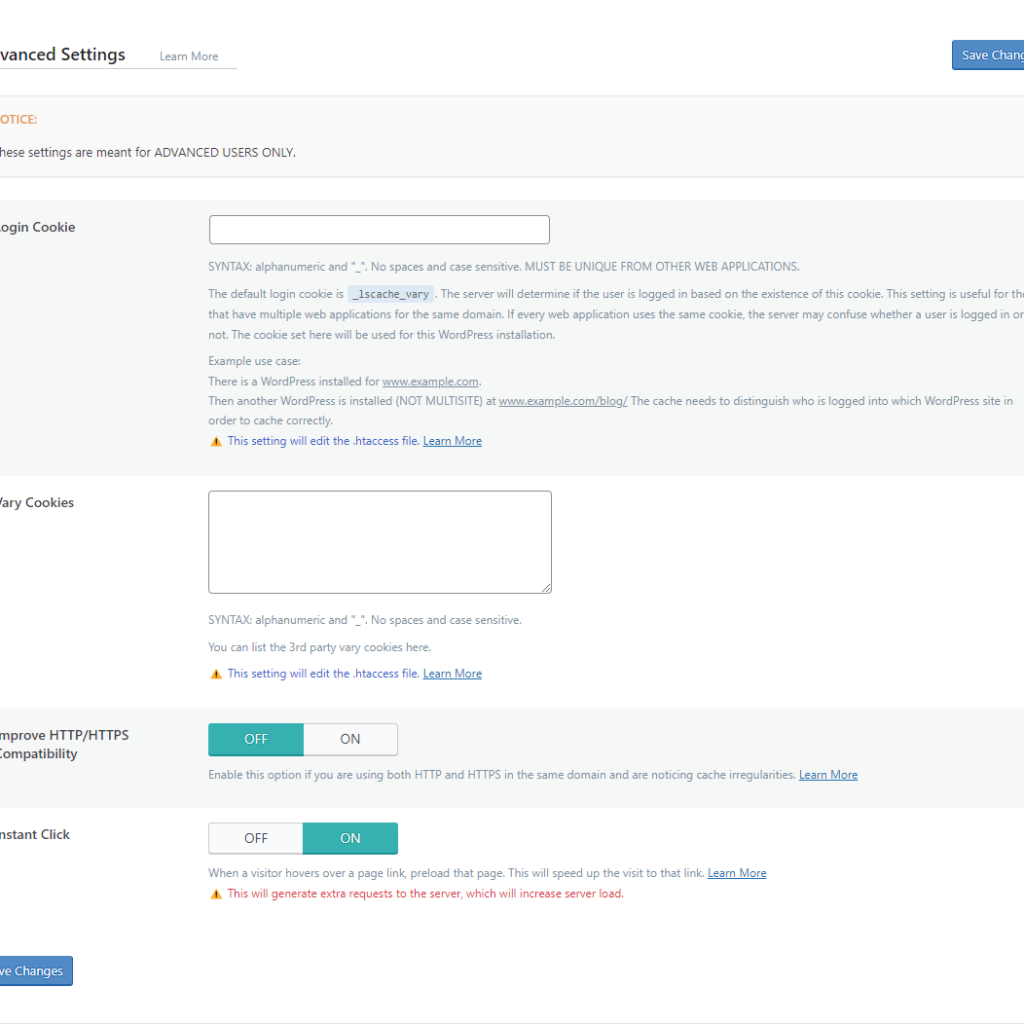
In the ‘Advanced’ tab setting, the only option that you need to Toggle On is the Instant Click option. This will generate a warning saying that enabling this generates extra requests to the server. Don’t worry as long as your server is handling all the requests made, ignore this. Otherwise disable it, and move on to the CDN setting from the left WordPress menu.
Previously, at the start of configuration we enabled the QUIC.cloud CDN so it should already be toggled ON here. The rest of the things in the ‘CDN Settings’ tab are pretty good set by default and you won’t be needing any changes there.
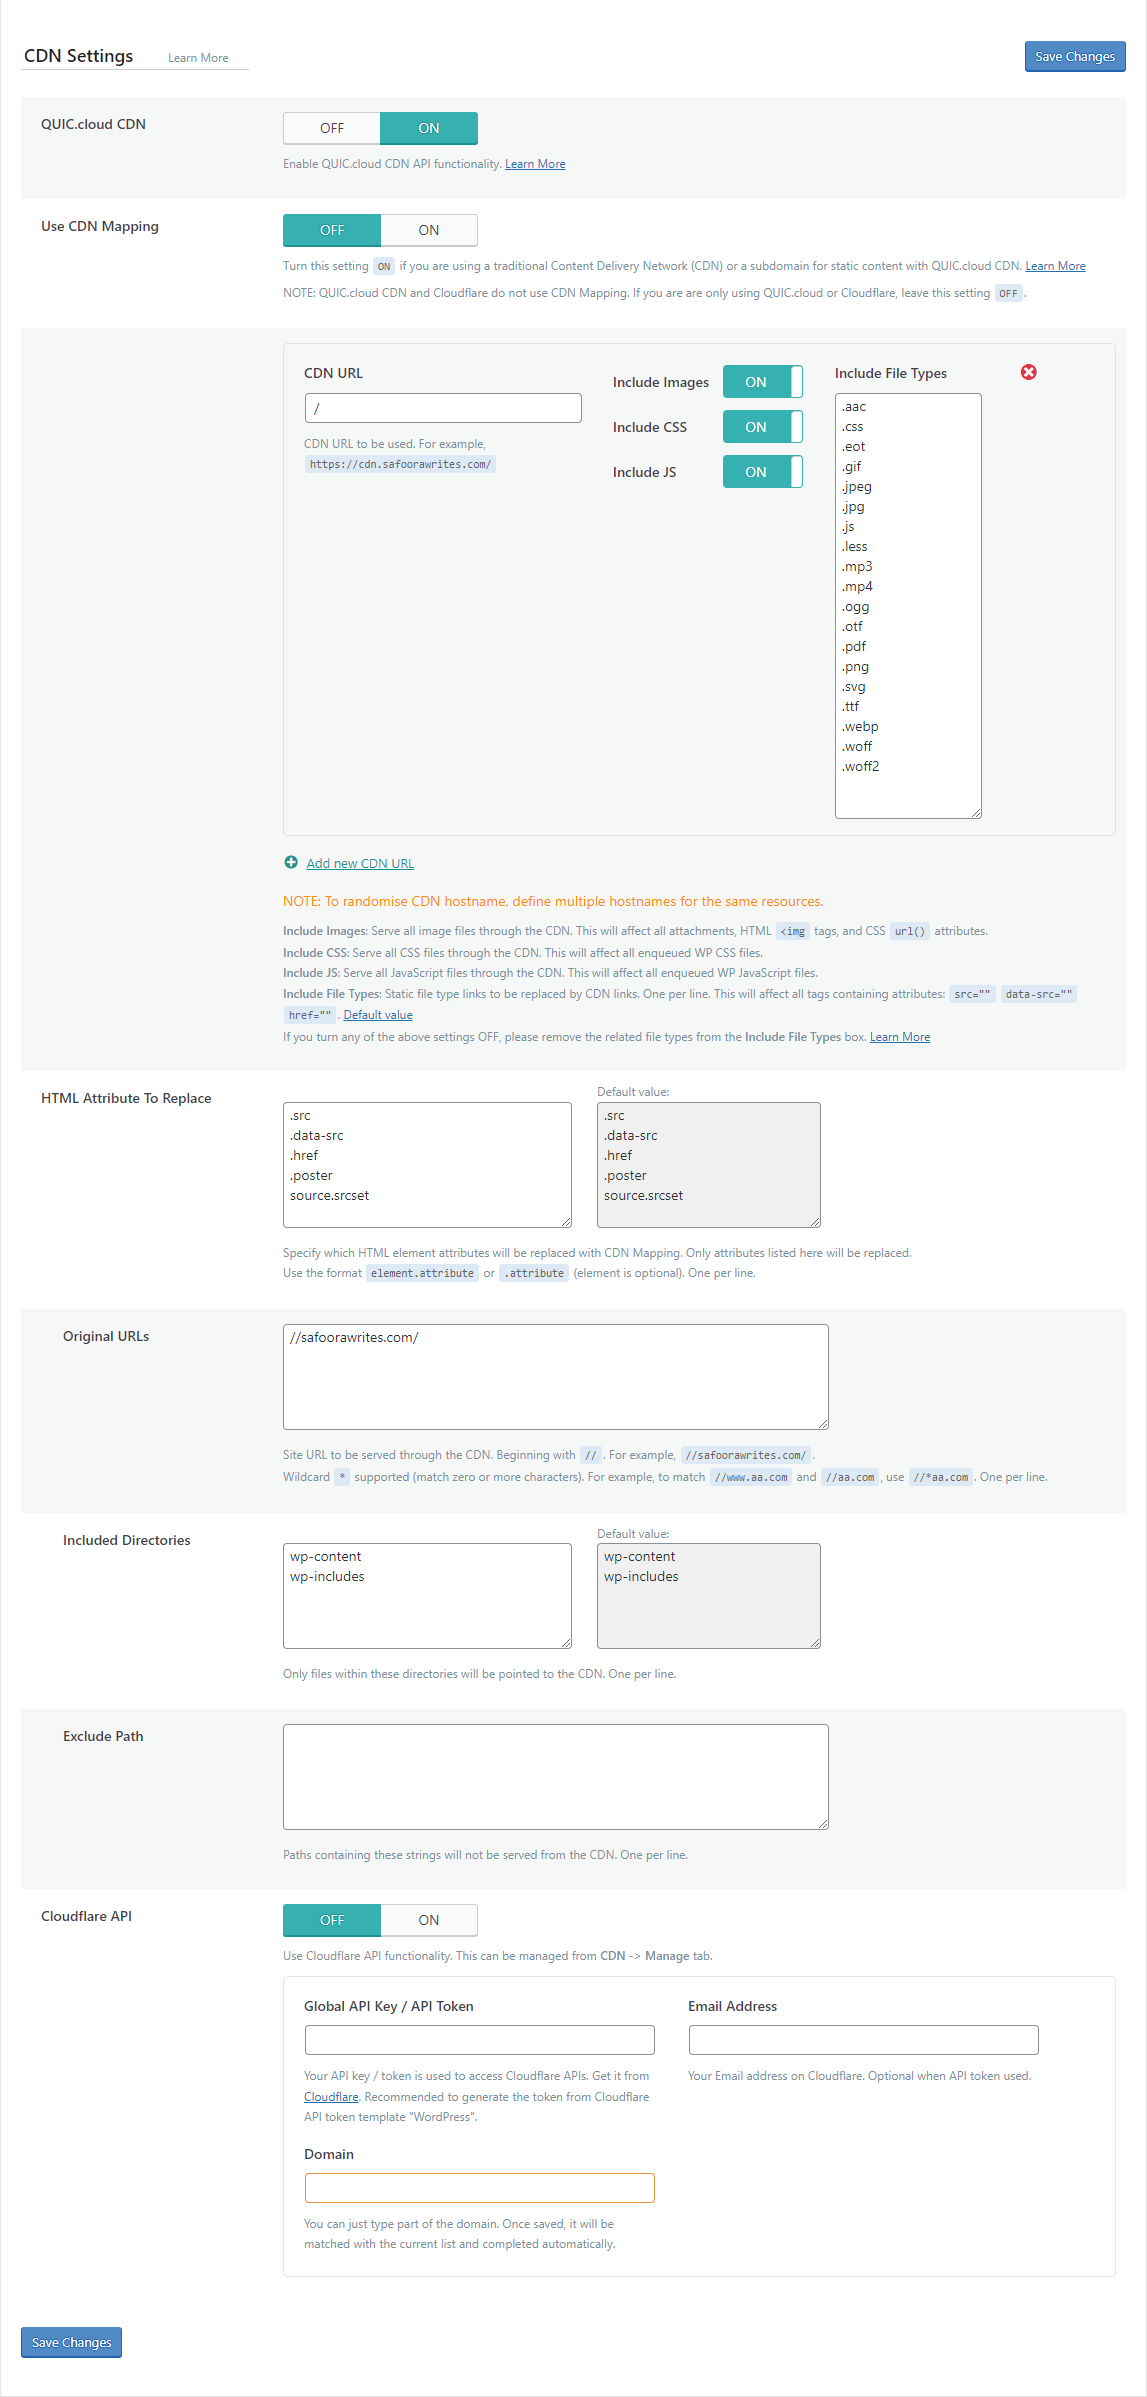
So, we move onto the next tab which is ‘QUIC.cloud CDN Setup’. Now the settings here are applied when you want the entire traffic of your website rerouted through QUIC.cloud which is usually required when your website gets users from all around the world.
By rerouting thrugh QUIC.cloud your website will basically use the CDN which delivers your site content from the nearest server somewhere in the world. So, in case your audience is not everywhere around the globe, you can skip setting this up as I’d be doing here.
The last tab on the CDN settings: “Manage” does not requires any changes again so we skip that and move onto the ‘Image Optimization’ setting from left menu on WordPress.
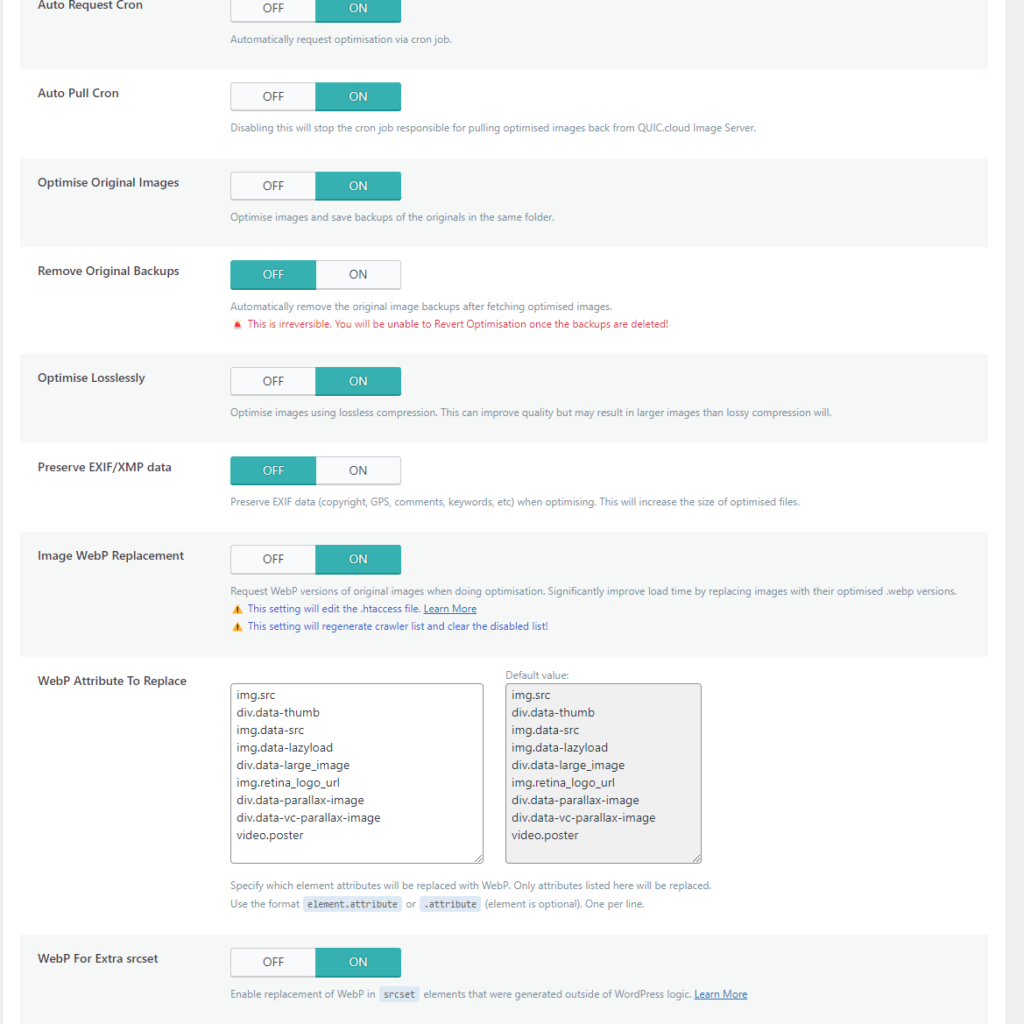
In the Image Optimization setting we go directly to the ‘Image Optimization Settngs’ tab skipping the first ‘Image Optimization Summary’ tab. In the Imag Optimization Settings tab, Toggle ON the Auto Request Cron. The Auto Pull Cron and Optimize Original Images would be Toggled ON by default which is good.
Next the Remove Original Backups setting should be Toggled OFF. This is crucial because in the future if you want to uninstall LightSpeed Plugin for some reason, you’re going to need to have the original images on hand. Toggling Remove Original Backups to ON setting will remove the original images which could make your site lose useful data.
As for the ‘Optimize Losslessly’ option, if you are a photographer and your website showcases your photograph portfolio, you are going to need to keep this option Toggled ON. That way lossless compression helps keep quality a bit better and the file size would be larger. Normally, users keep this setting OFF.
The ‘Preserve EXIF/XMP data’ is Toggled ON by default, but you need to turn this OFF. This will save just a little bit of size on your images.
The ‘Image WebP Replacement’ if turned OFF by default, and you’ll need to toggle this ON. This helps because WebP is way faster than jpegs and pngs. ‘WebP Attribute To Replace’ settings does not require any changings and so we skip it and move on to ‘WebP For Extra srcset’ which is set to OFF by default. You’ll beneeding to turn it ON.
The last setting ‘WordPress Image Quality Control’ can be altered if you feel not satisfied or happy with the current image compression quality settings. By default the value is set to 82, any value below 100 is fine, you can adjust accordingly. Save the changes and then we head over to the skipped tab: ‘Image Optimization Summary’.
In the ‘Image Optimization Summary’ tab all you need to do is press the ‘Send Optimization Request’ button. By pressing this button, all your images would be sent out to the QUIC.cloud and will be optimized. Max of 200 images can be sent at once for optimization request.

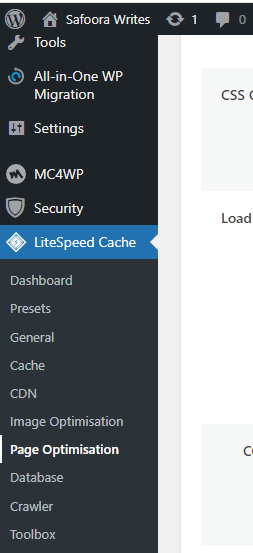
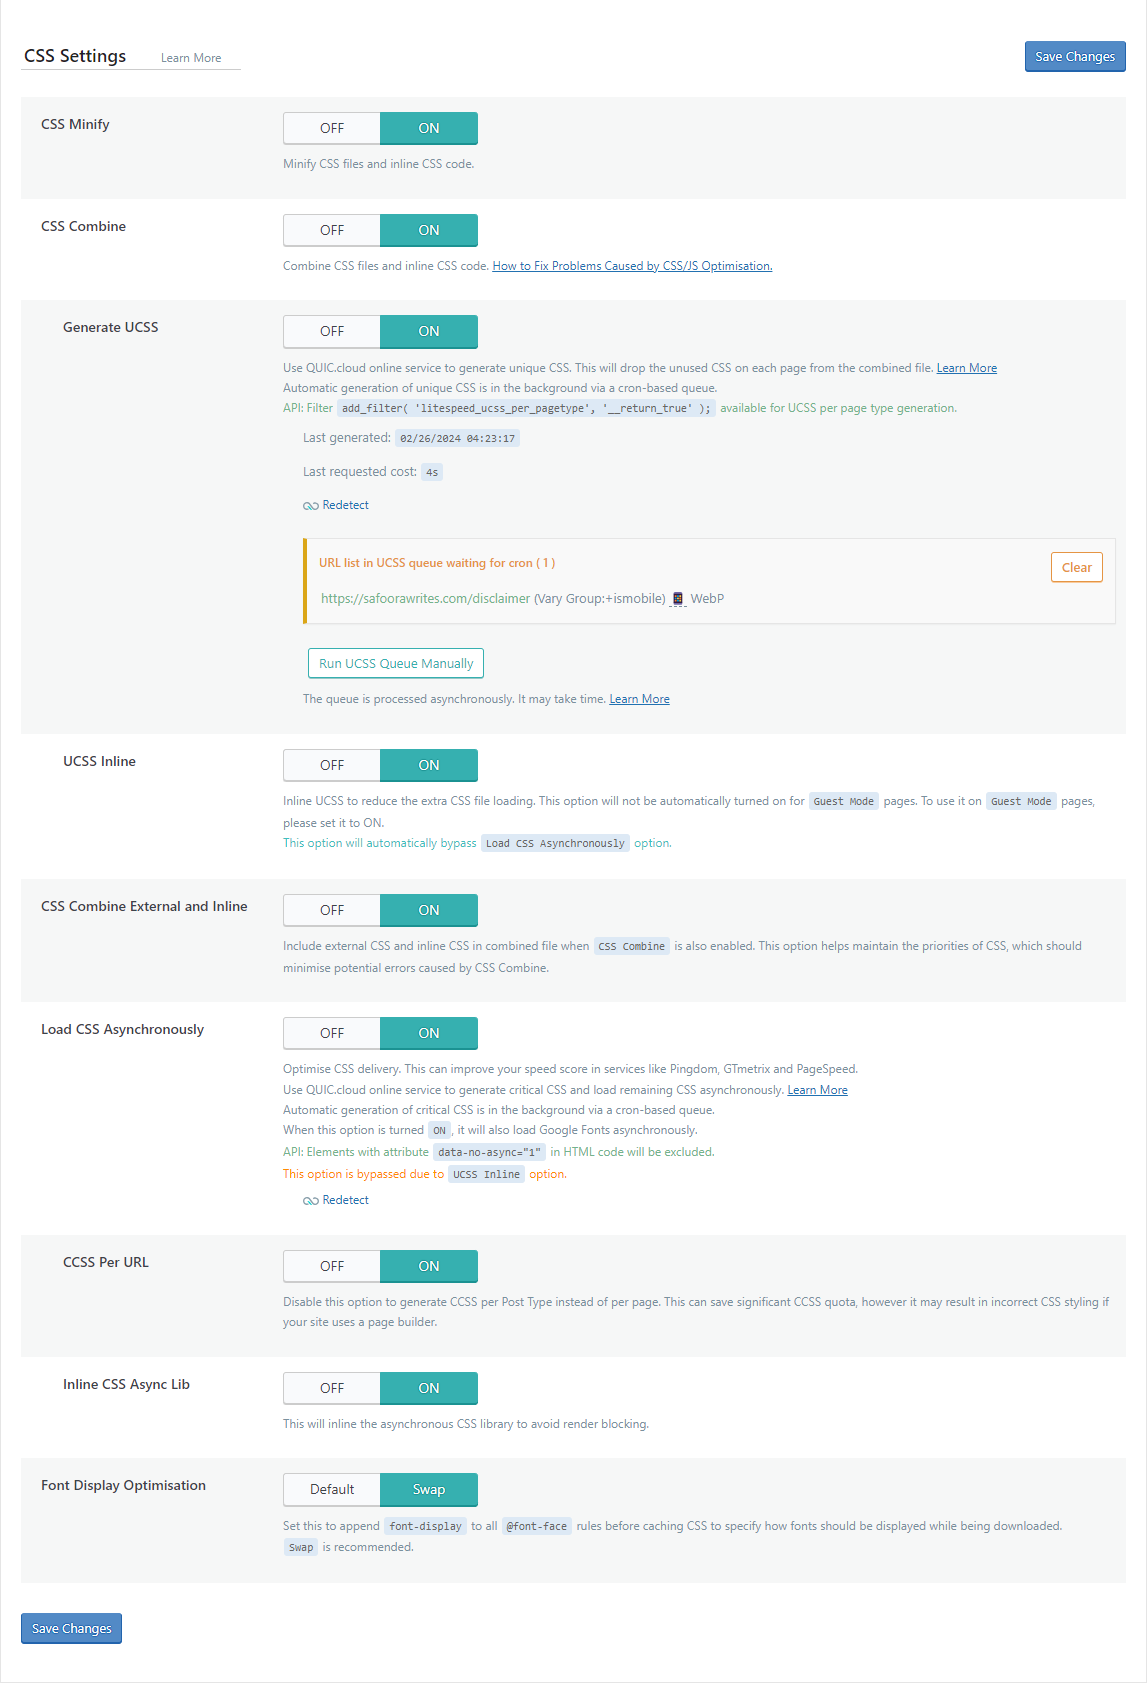
Next move onto the ‘Page Optimization’. Here, Toggle ON the CSS minify, CSS Combine, Generate UCSS, and UCSS Inline. Note that should you fine the front-end of your website misbehaving, you can always turn off the CSS Combine functionality. As was the case I faced: My Menu was not appearing on the home screen so I turned CSS combine option OFF which resolved the issue.
‘CSS Combine External and Inline’ as well as the ‘Load CSS Asynchronously’, ‘CCSS per URL’, and ‘Inline CSS synch Lib’ all need to be toggled ON. The ‘Font Display Optimization’ should be set to ‘Swap’ rather than Default. Save changes made and move onto the next tab which is ‘JS Settings’.
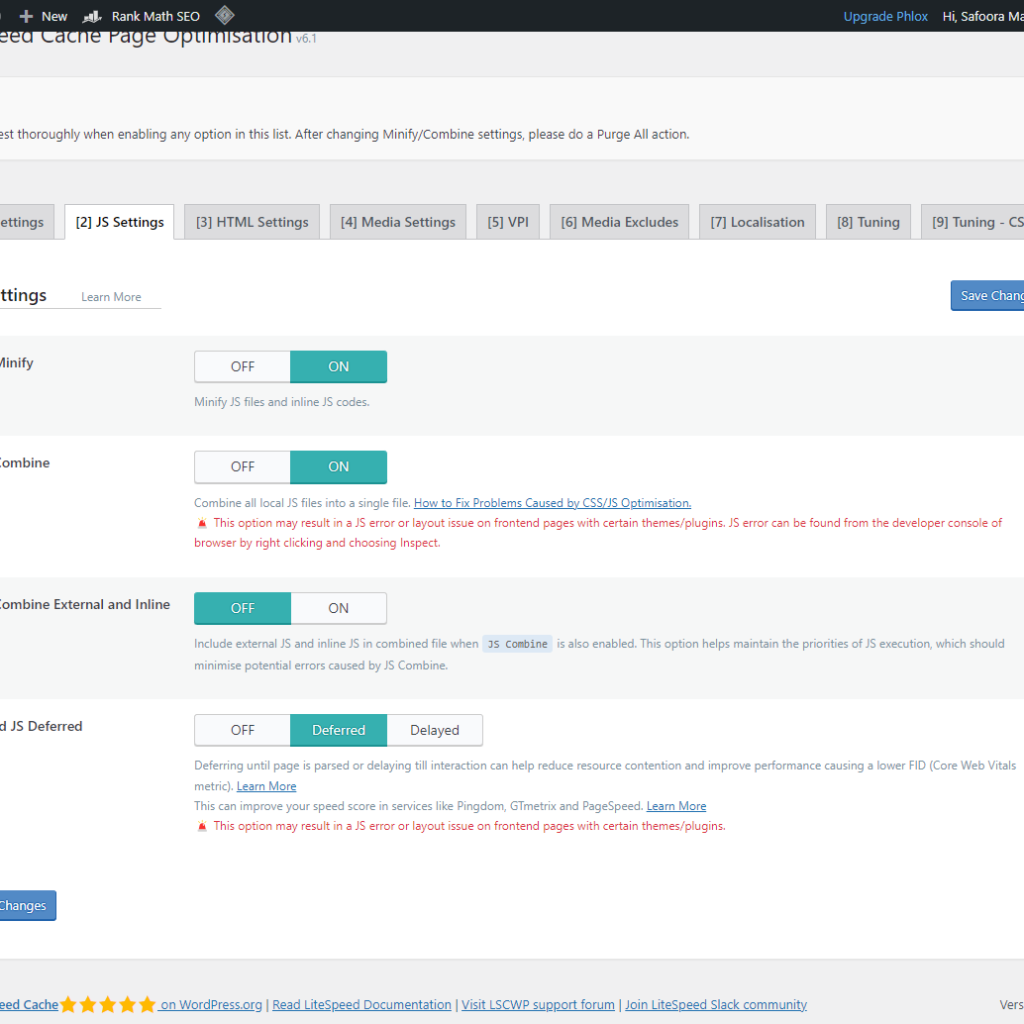
In the JS Settings tab, toggle all options (JS Minify, JS Combine, JS Combine External and Inline) to ON. Set ‘Load JS Deferred’ to Deferred. Save changes and move onto HTML Settings.
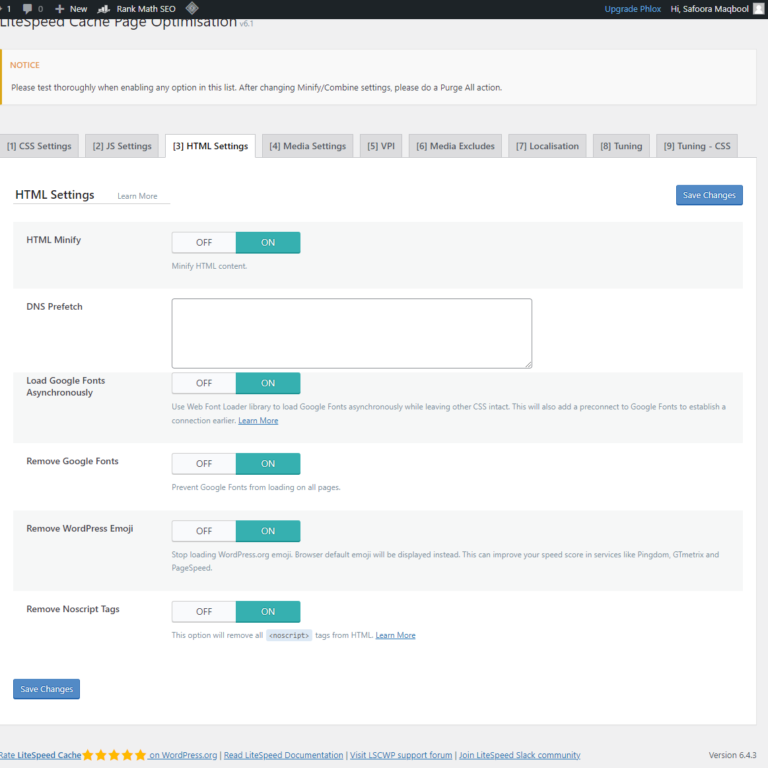
In the HTML settings, you’ll need to turn ON all the following: HTML Minify, DNS Prefetch Control, Remove Query Strings, Load Google Fonts Asynchronously, Remove Google Fonts (if you are not using any Google fonts), Remove WordPress Emoji, and Remove Noscript Tags. Save changes and move onto ‘Media Settings’ tab.
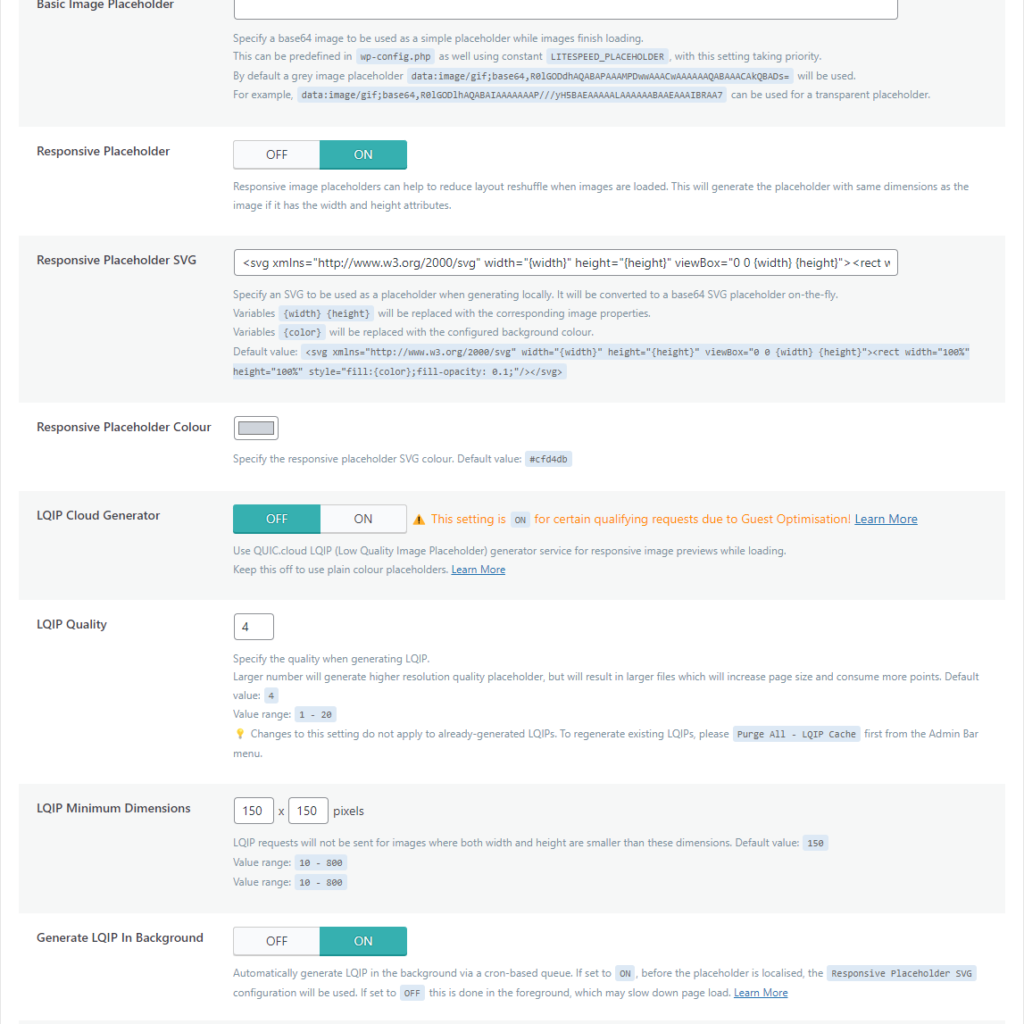
In the Media Settings tab, first off turn ON the Lazy Load Images. You’ll also need the Responsive placeholder toggled ON. This helps in reducing the layout shuffling and that’s how it stabilizes (improves) your CLS (Cumulative Layout Shift) score.
Next you could toggle ON the (Low Quality Image Placeholder) LQIP Cloud Generator which basically is helps generate low quality responsive image previews when the image is yet being loaded. You can prefer to keep this OFF if you do not want the image to be low quality. I prefer keeping this ON with LQIP value 4 and the ‘Generate LQIP in Background’ toggled ON.
If you are using iframes on your site you can toggle ON the ‘Lazy Load iframes’ option. Most people don’t use iframes so, they can keep this toggled OFF. The last option ‘Add Missing Sizes’ will also be set to toggled ON as it helps save a lot of layout shifts thus, improving your CLS. Save Changes and move onto the View Port Images ‘VPI’ tab settings.
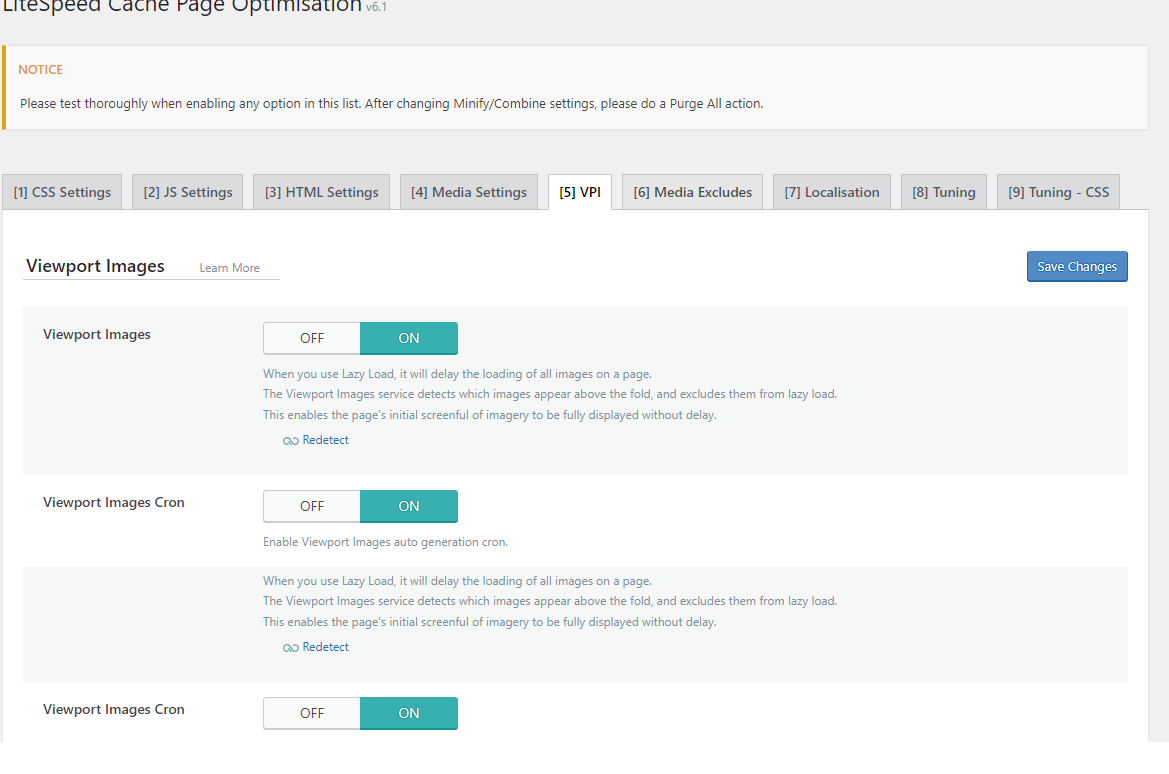
In the VPI settings, turn ON the ‘Viewport Images’ option. What this will do is that when your page loads, everything above the fold will not be lazy loaded whereas everything under the fold will be lazy loaded. This ultimately helps in improving your Core Web Vitals scores and also the UX. Similarly, you’ll need to set Viewport Images Cron to ON settings. Save the changes made and move onto the next tab ‘Media Excludes’.
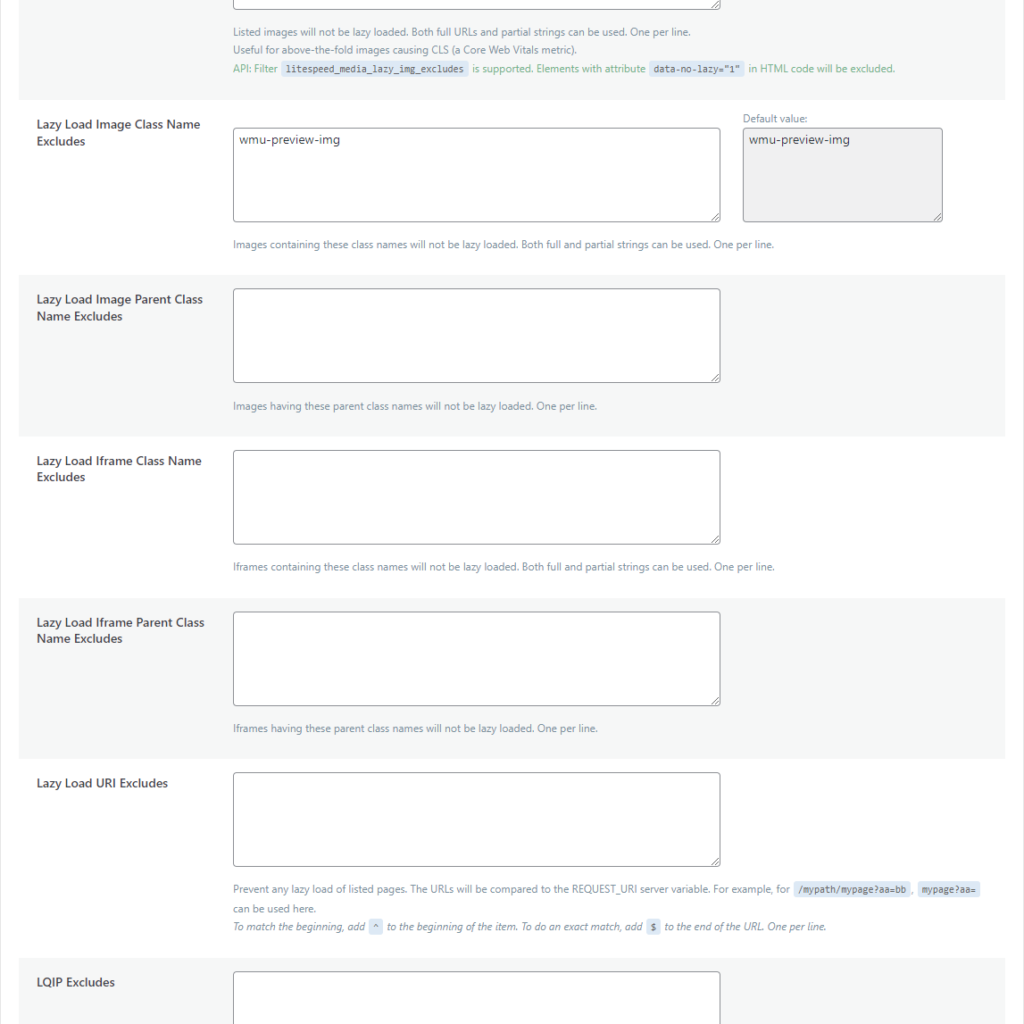
In the ‘Media Excludes’ tab, you basically filter out the images on your website that you do not want to be lazy loaded e.g. your site’s logo. To do this go to your WordPress media and select the logo image, copy its destination URL. Come back to the ‘Media Excludes’ tab option in the Page Optimization setting of the LiteSpeed Cache Plugin.
Paste the copied URL of your logo media file into the ‘Lazy Load Image Excludes’. Press the save changes button and your logo image will never be lazy loaded on the website. The excluding option in a similar way can also be applied to the CSS classes. You can adjust according to your needs now that you know how it works.
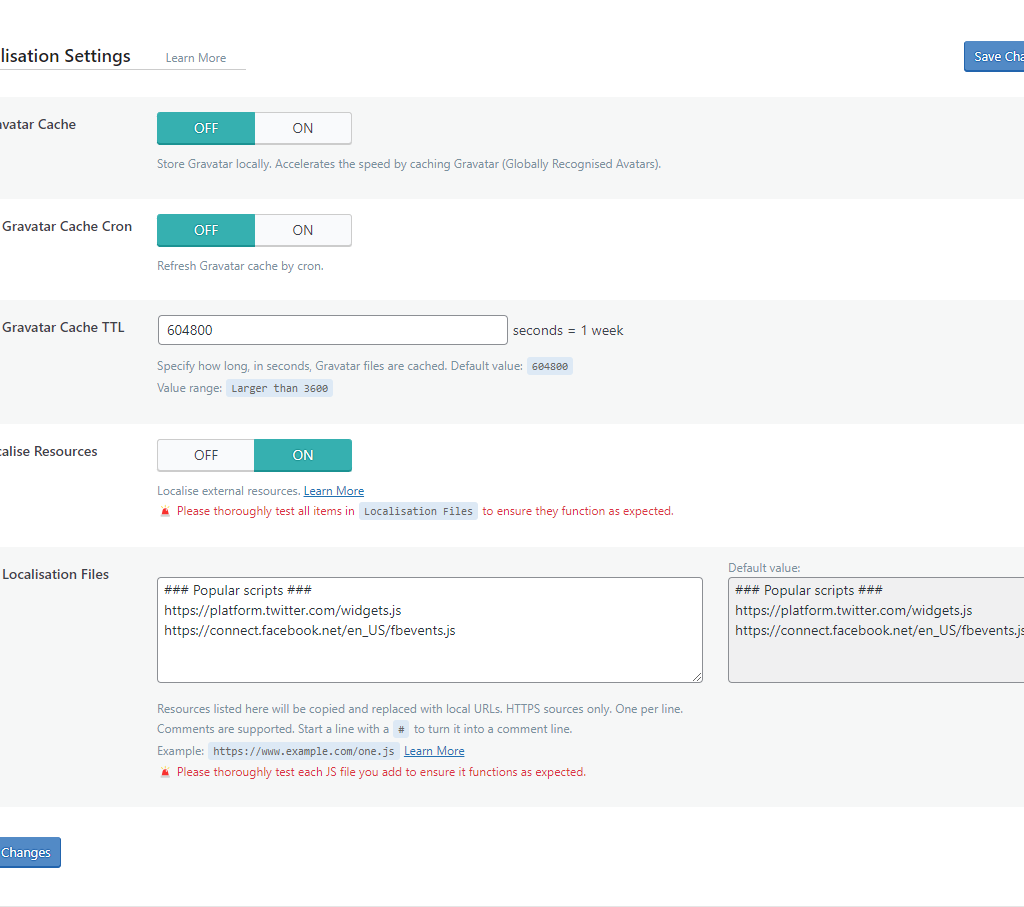
Next, we move onto the ‘Localization’ tab. The gravatars feature comes in handy when lot of people go to your website and use gravatars. In such a case you’ll need to toggle ON the Gravatar Cache option so that the images of the grafters get cached. Also toggle ON the ‘Gravatar Cache Cron’. The Gravatar Cache TTL is by default set to 1 week which equals 604800 seconds which is just great.
Last but not least, the ‘Localize Resources’ option in the localization tab should also be set to ON so that it localizes the external resources from google or Facebook (if you are using them) within the LightSpeed. That way, it’ll always serve from your own website and this could be really useful when testing out your site on GTmetrics or Google PageSpeed Insights. Save the changes made and then move onto the Tuning tab.
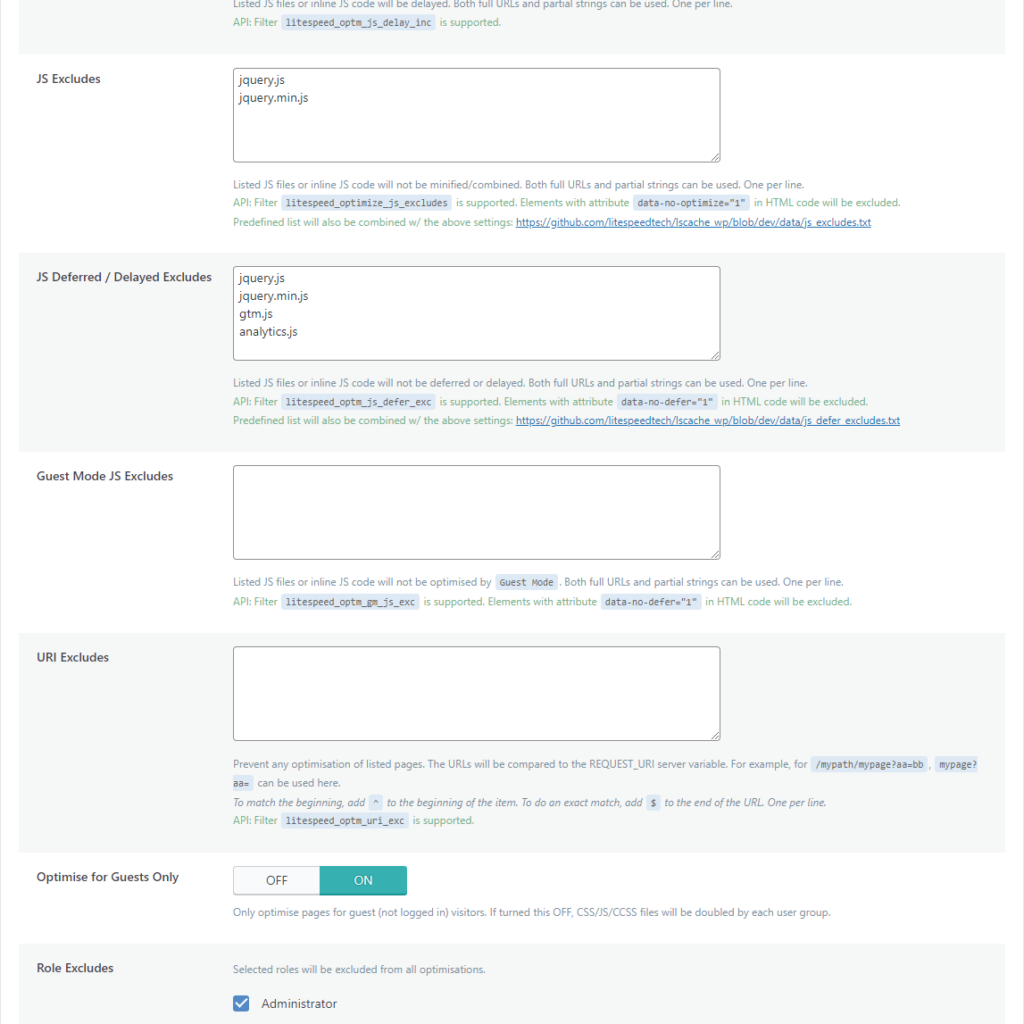
In the Tuning tab you can exclude some JavaScript guest mode URL excludes if you want. In the Role Excludes select the administrator to exclude yourself from caching and all optimization. This is useful when you are creating pages and want to view them. You can also explore your website as a guest with full speed by opening up your website in a new private browsing window. Save the changes and we skip the CSS Tuning tab settings as we do not want to add any excludes for now.
Next, we move onto the ‘Database’ settings of LiteSpeed Cache Plugin from the left WordPress menu. Here you can optimize your database. Be careful though, it is a bit tricky here i.e. say for example you delete all your post revisions, there won’t be no way back to go to the page and restore a revision.
So, if you often restore revisions, I recommend NEVER clearing the post revisions. Some websites have a lot of spam comments, trash, and also a lot of transients coming in. All these you can clear without hesitation because spam comments and trash don’t matter, whereas transients are the settings from other plugins which have been removed from your website. Clearing your site database of this unnecessary load will make it lighter. Remember that a clean database is a fast database.
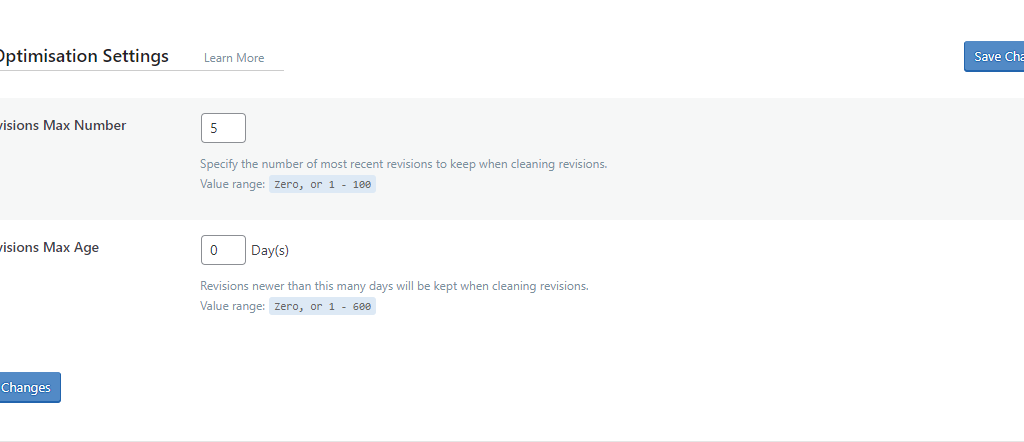
Moving on to the ‘DB Optimization Settings’ tab, you can actually set the frequency of Revisions Max Number. The frequency number ‘n’ you enter here means that LiteSpeed Cache will hold record of only the last ‘n’ number of revisions. You can also limit this to the number of days you require the record of revisions maintained. I go with setting the frequency number 5 for last revisions record keeping.
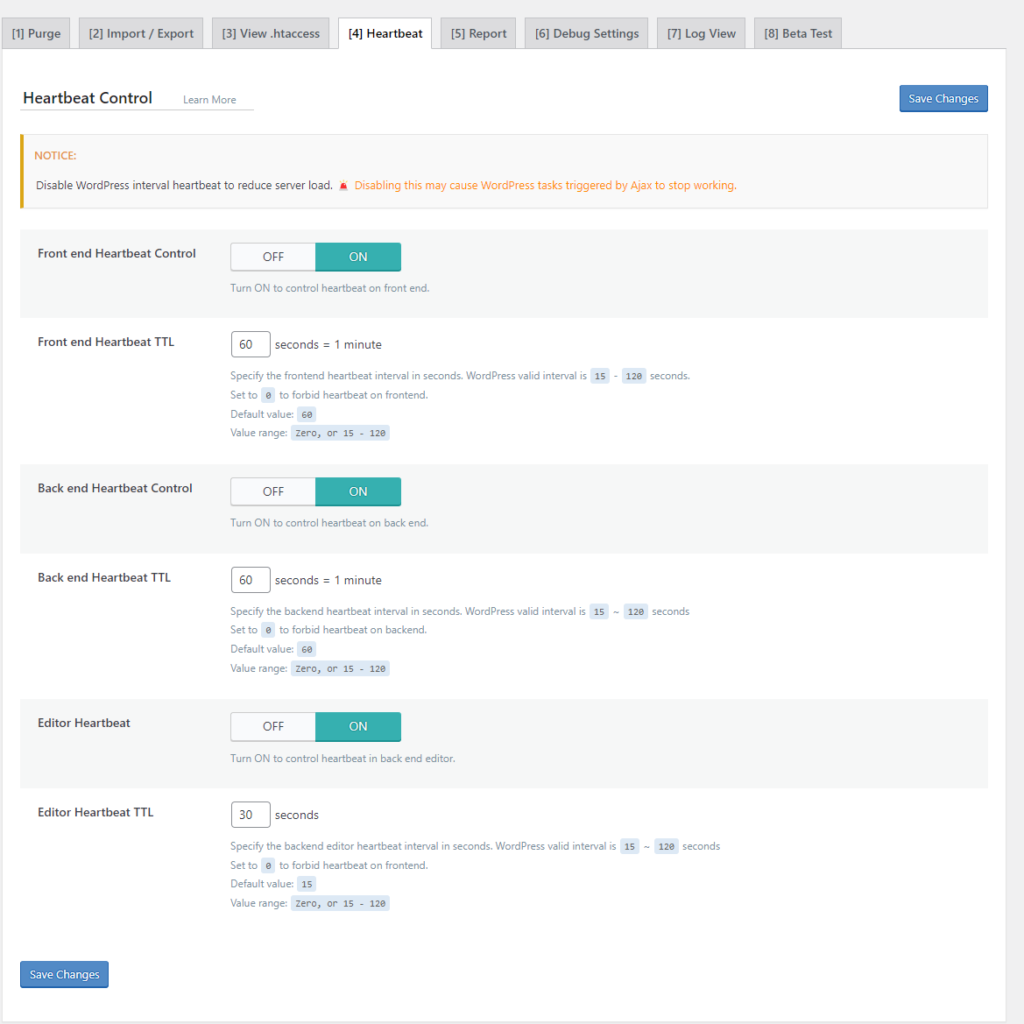
Next the ‘Crawler’ setting of the LightSpeed Cache plugin does not require any changes made so we move onto the ‘Toolbox’ settings and head straight to the ‘Heartbeat’ tab. Over there, toggle ON the Frontend Heartbeat Control.
This is important because if you can control the heartbeat of your website and set it to 60 seconds, it will definitely impact your server resources in a positive way.
Also, toggle ON the Backend Heartbeat Control and the Editor Heartbeat. Change the value of Editor Heartbeat TTL from 15 seconds to 30 seconds. Save the changes made.
And that’s it you have got your LiteSpeed Cache for WordPress Plugin configured!
Head back to Google PageSpeed Insights and recheck your site score. It must have improved significantly!

Take it to your Inbox!
Subscribe to my Newsletter
Never miss the Tips, Tricks, and Insights that I share on my site.

Add a Comment